1. ROS 2 network statistics using Vulcanexus Tools
Table of Contents
1.1. Background
Vulcanexus integrates eProsima Fast DDS Monitor, which is a useful tool for monitoring and studying a ROS 2 network as ROS 2 relies on the DDS specification to communicate the different nodes. The automatic discovery of entities in a local network enables to easily identify the different running Participants, their Endpoints, the Topics that each of them is using, and even the network interfaces they are employing to communicate with one another. Additionally, it is possible to receive statistical data from every endpoint in the network leveraging the Fast DDS Statistics Module. This data is very useful to analyze the DDS network performance and seek possible communication problems in it.
This tutorial provides step-by-step instructions to use Vulcanexus to monitor a ROS 2 talker/listener demo.
1.2. Prerequisites
Ensure that the Vulcanexus installation includes the Vulcanexus tools (either vulcanexus-galactic-desktop, vulcanexus-galactic-tools, or vulcanexus-galactic-base).
Also, remember to source the environment in every terminal in this tutorial.
source /opt/vulcanexus/galactic/setup.bash
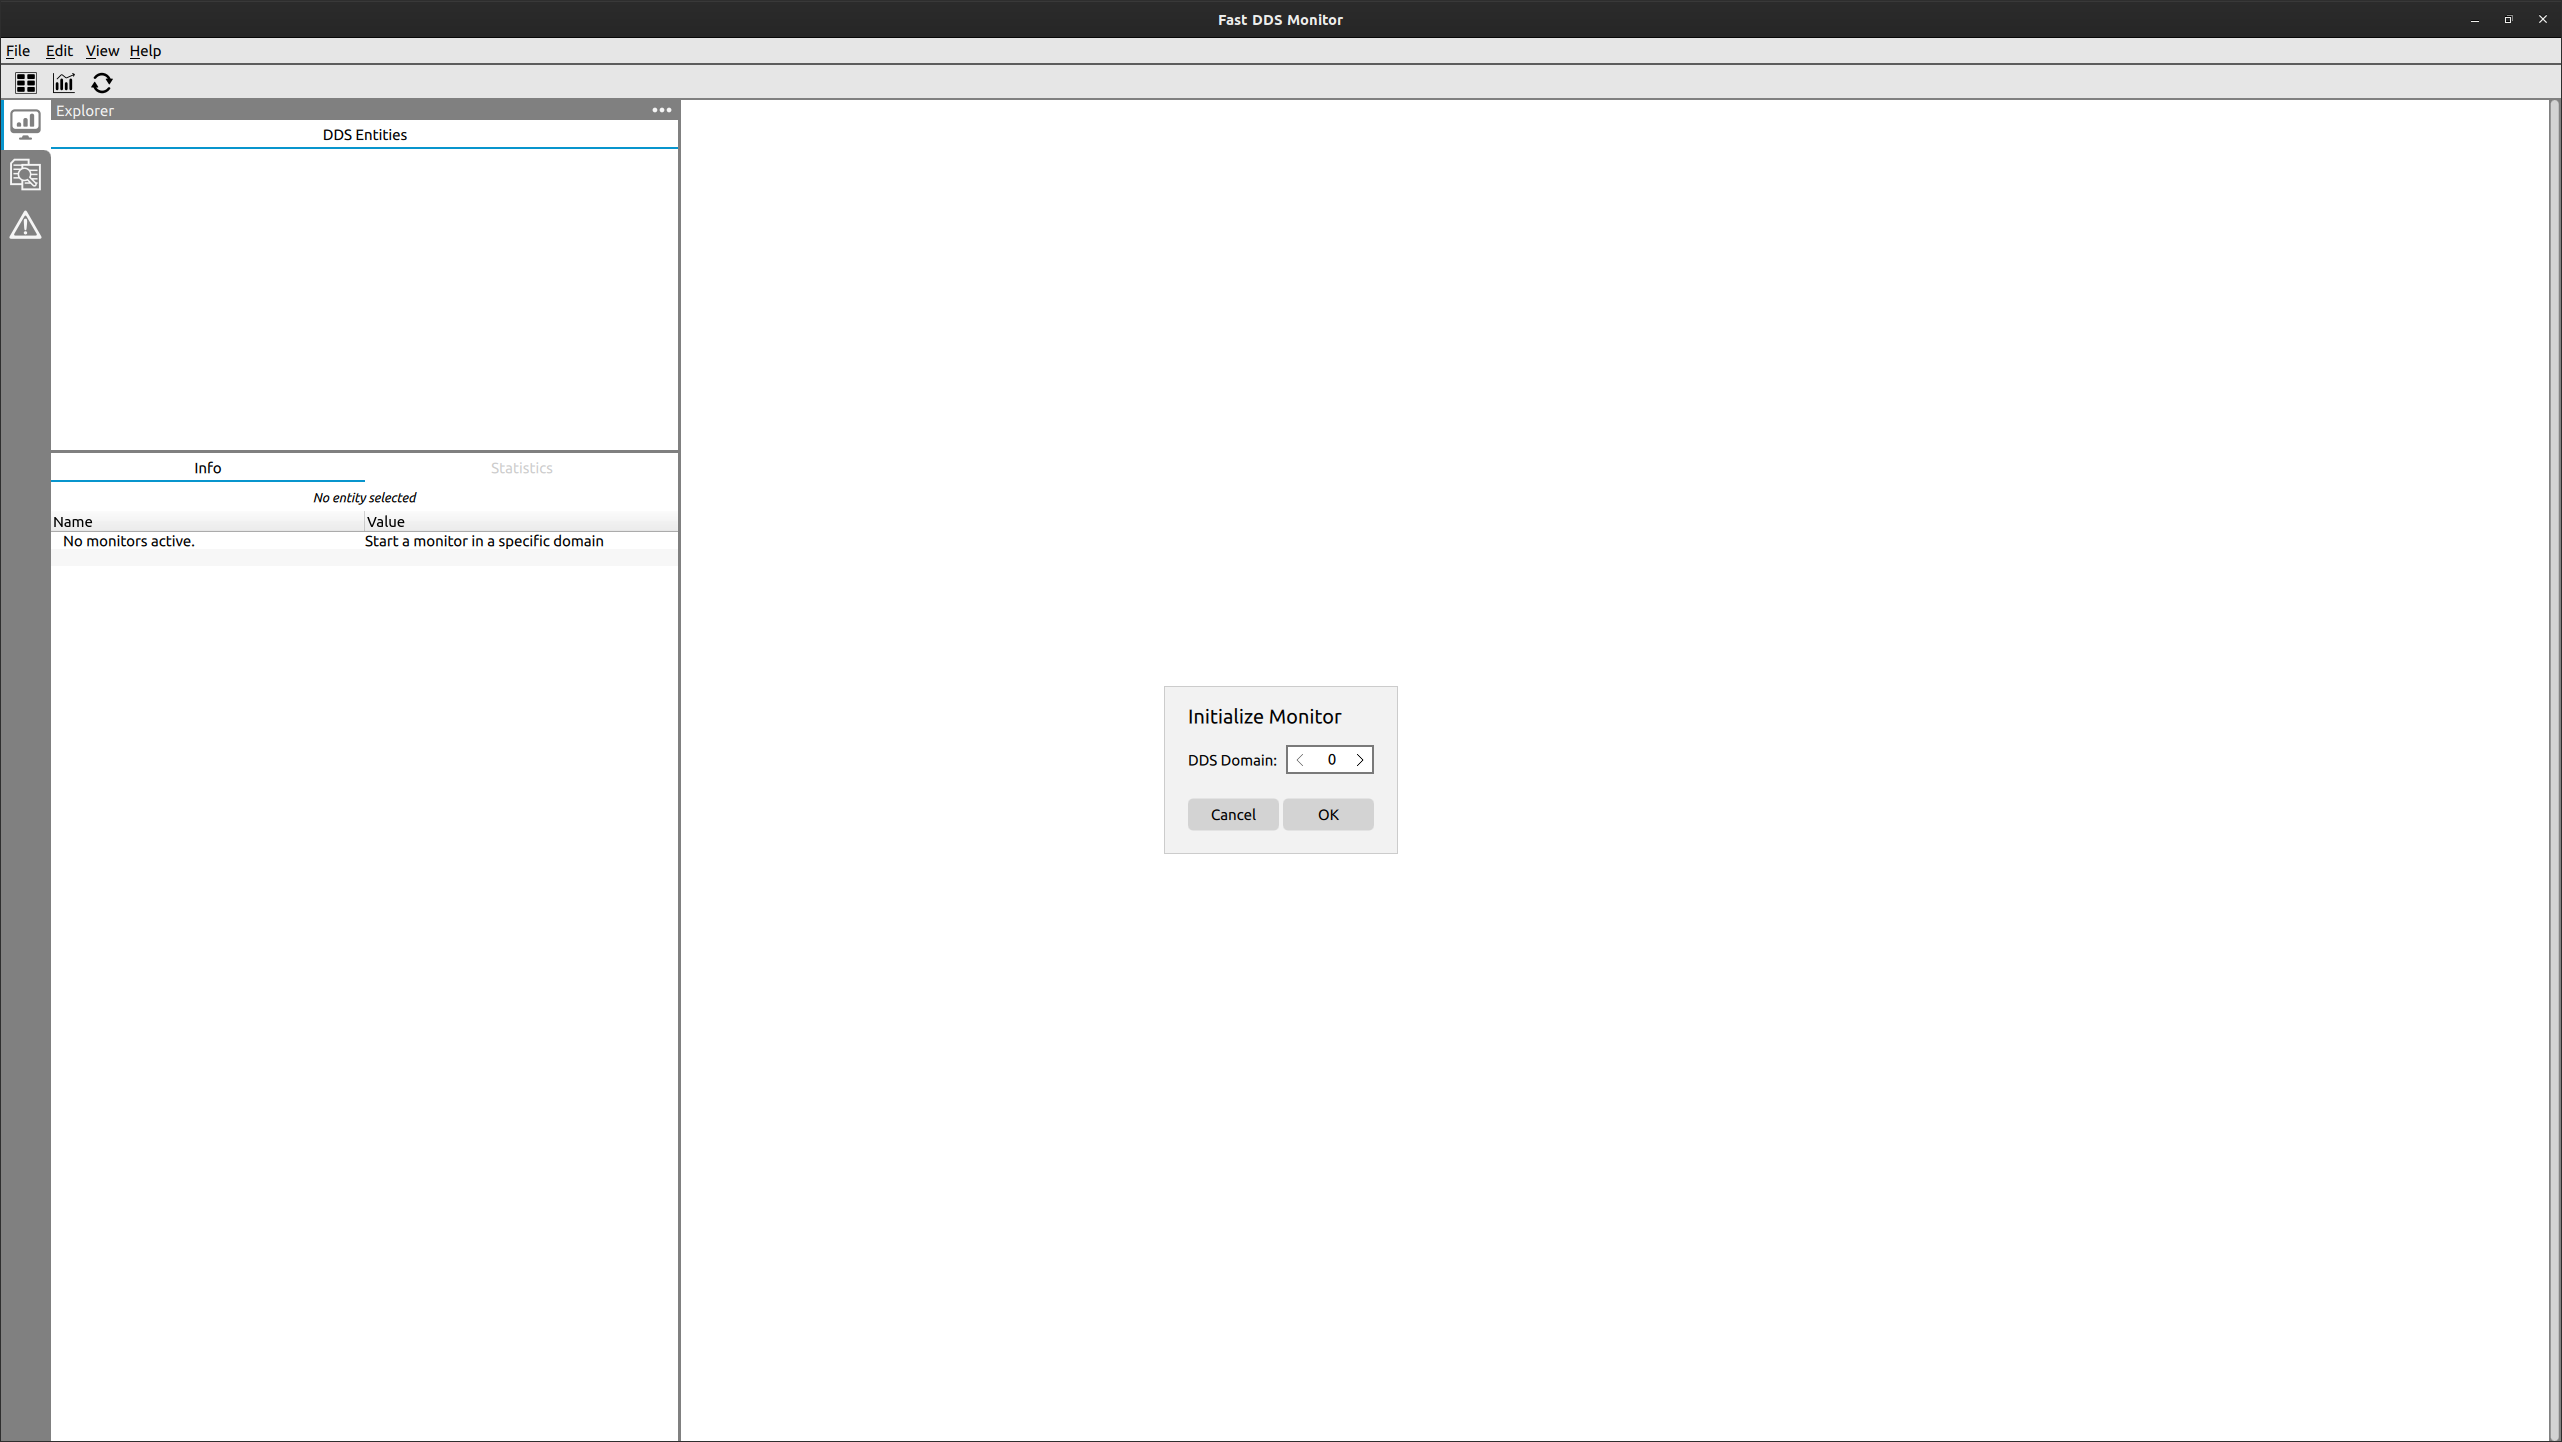
1.3. Launch Fast DDS Monitor
Initiate Fast DDS Monitor running the following command:
fastdds_monitor
Once Fast DDS Monitor is launched, start a monitor in domain 0 (default domain).
1.4. Execute ROS 2 demo nodes with statistics
In order to activate the publication of statistical data, eProsima Fast DDS requires an environment variable specifying which kinds of statistical data are to be reported.
Consequently, before launching the ROS 2 nodes, remember to set FASTDDS_STATISTICS environment variable.
Run the following commands in different terminals (remember to source the Vulcanexus environment):
export FASTDDS_STATISTICS="HISTORY_LATENCY_TOPIC;NETWORK_LATENCY_TOPIC;PUBLICATION_THROUGHPUT_TOPIC;\
SUBSCRIPTION_THROUGHPUT_TOPIC;RTPS_SENT_TOPIC;RTPS_LOST_TOPIC;\
HEARTBEAT_COUNT_TOPIC;ACKNACK_COUNT_TOPIC;NACKFRAG_COUNT_TOPIC;\
GAP_COUNT_TOPIC;DATA_COUNT_TOPIC;RESENT_DATAS_TOPIC;SAMPLE_DATAS_TOPIC;\
PDP_PACKETS_TOPIC;EDP_PACKETS_TOPIC;DISCOVERY_TOPIC;PHYSICAL_DATA_TOPIC"

ros2 run demo_nodes_cpp listener
export FASTDDS_STATISTICS="HISTORY_LATENCY_TOPIC;NETWORK_LATENCY_TOPIC;PUBLICATION_THROUGHPUT_TOPIC;\
SUBSCRIPTION_THROUGHPUT_TOPIC;RTPS_SENT_TOPIC;RTPS_LOST_TOPIC;\
HEARTBEAT_COUNT_TOPIC;ACKNACK_COUNT_TOPIC;NACKFRAG_COUNT_TOPIC;\
GAP_COUNT_TOPIC;DATA_COUNT_TOPIC;RESENT_DATAS_TOPIC;SAMPLE_DATAS_TOPIC;\
PDP_PACKETS_TOPIC;EDP_PACKETS_TOPIC;DISCOVERY_TOPIC;PHYSICAL_DATA_TOPIC"

ros2 run demo_nodes_cpp talker
1.5. Monitoring network
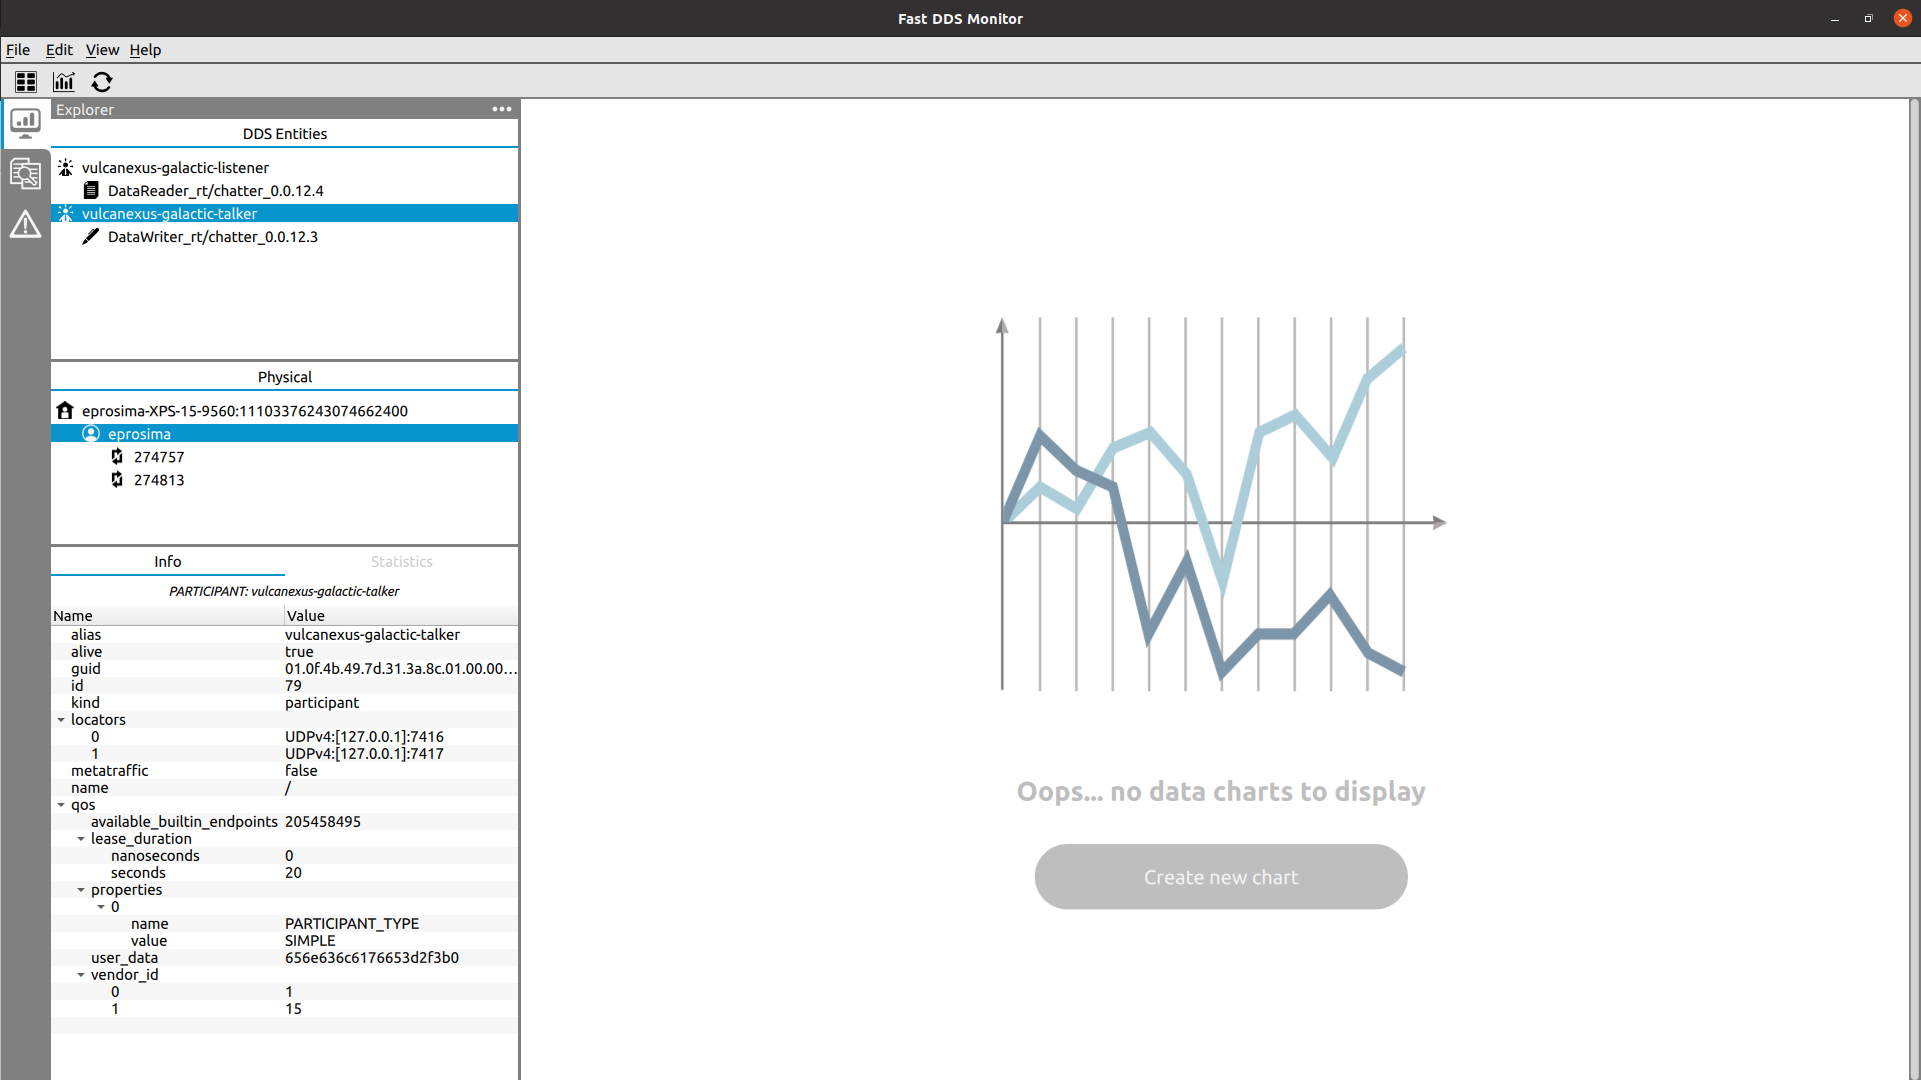
Now, the two new Participants are visible in the Fast DDS Monitor’s DDS Panel.
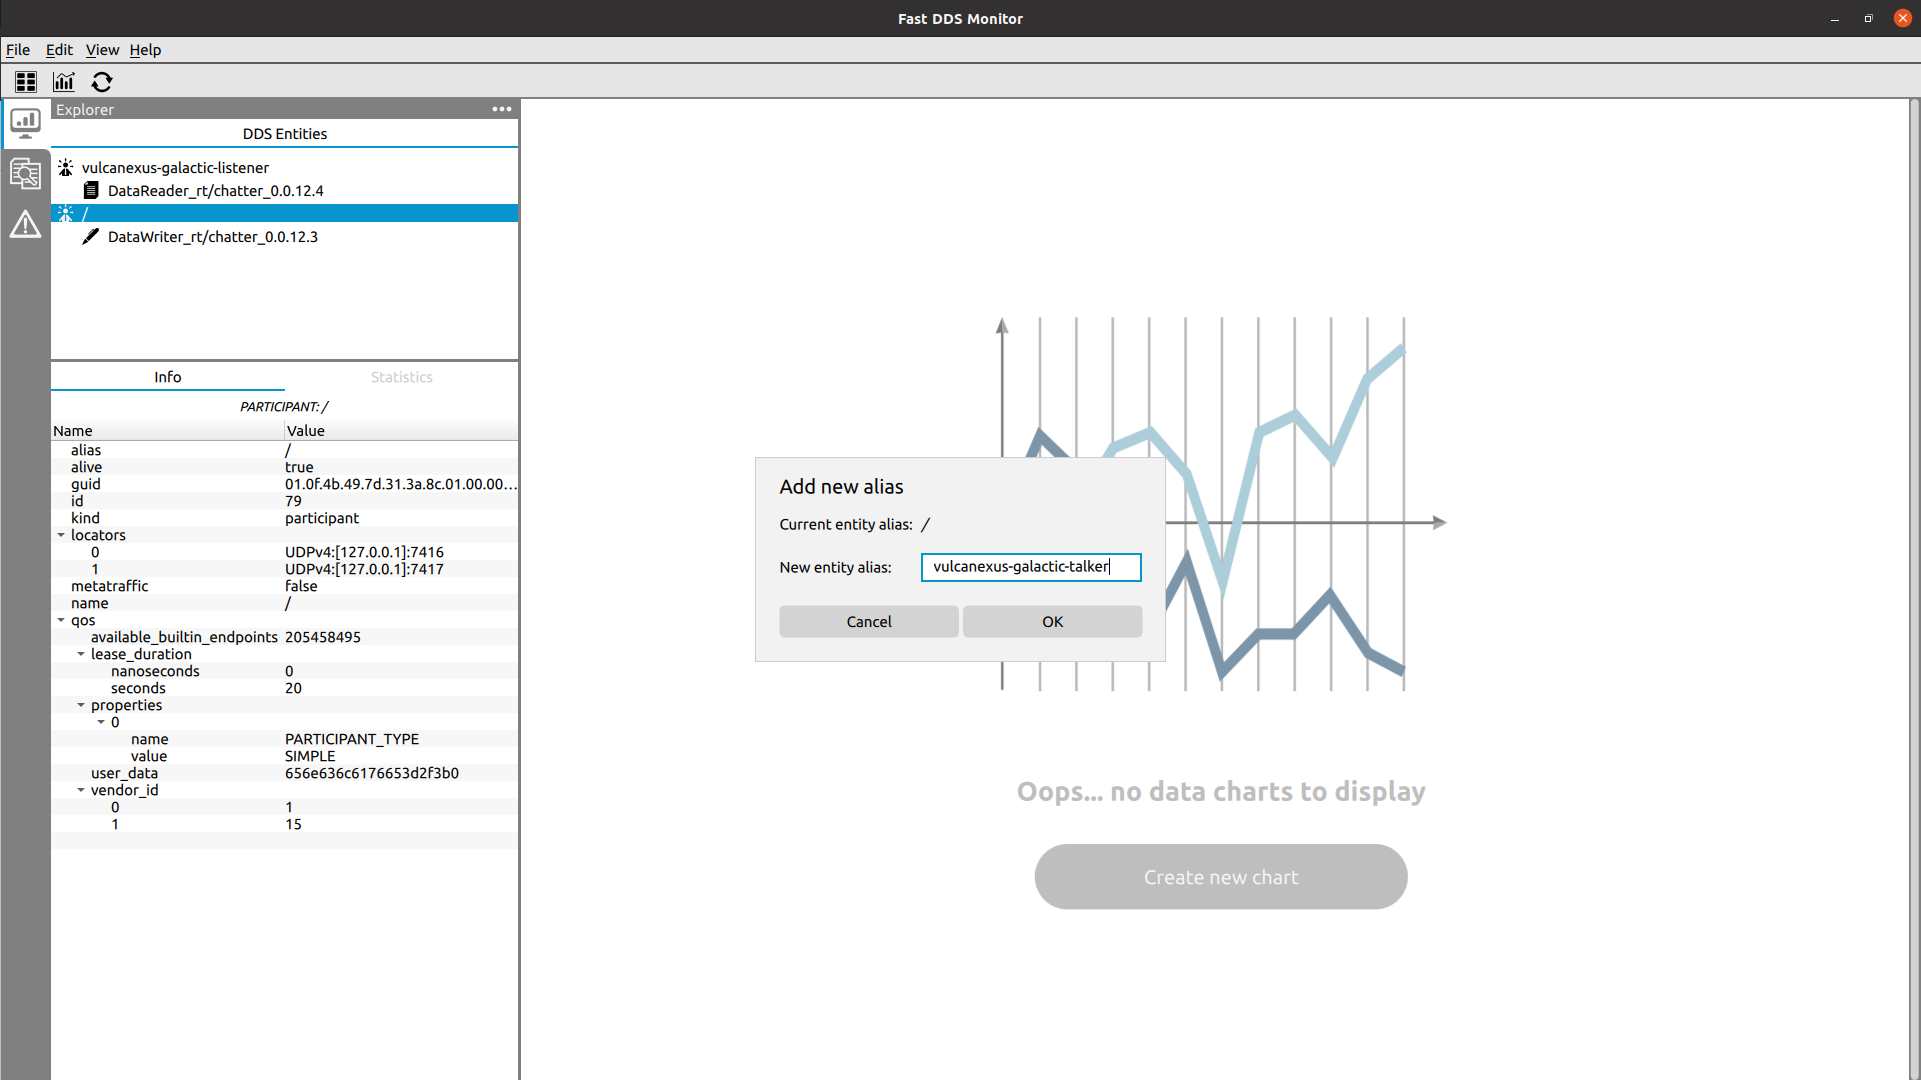
1.5.1. Alias
Participants in ROS 2 are named / by default.
In order to differentiate them, it is possible to change the Participant’s aliases within the Fast DDS Monitor.
In this case, the vulcanexus-galactic-talker Participant would be the one with a writer, and the vulcanexus-galactic-listener Participant would be the one with a reader.
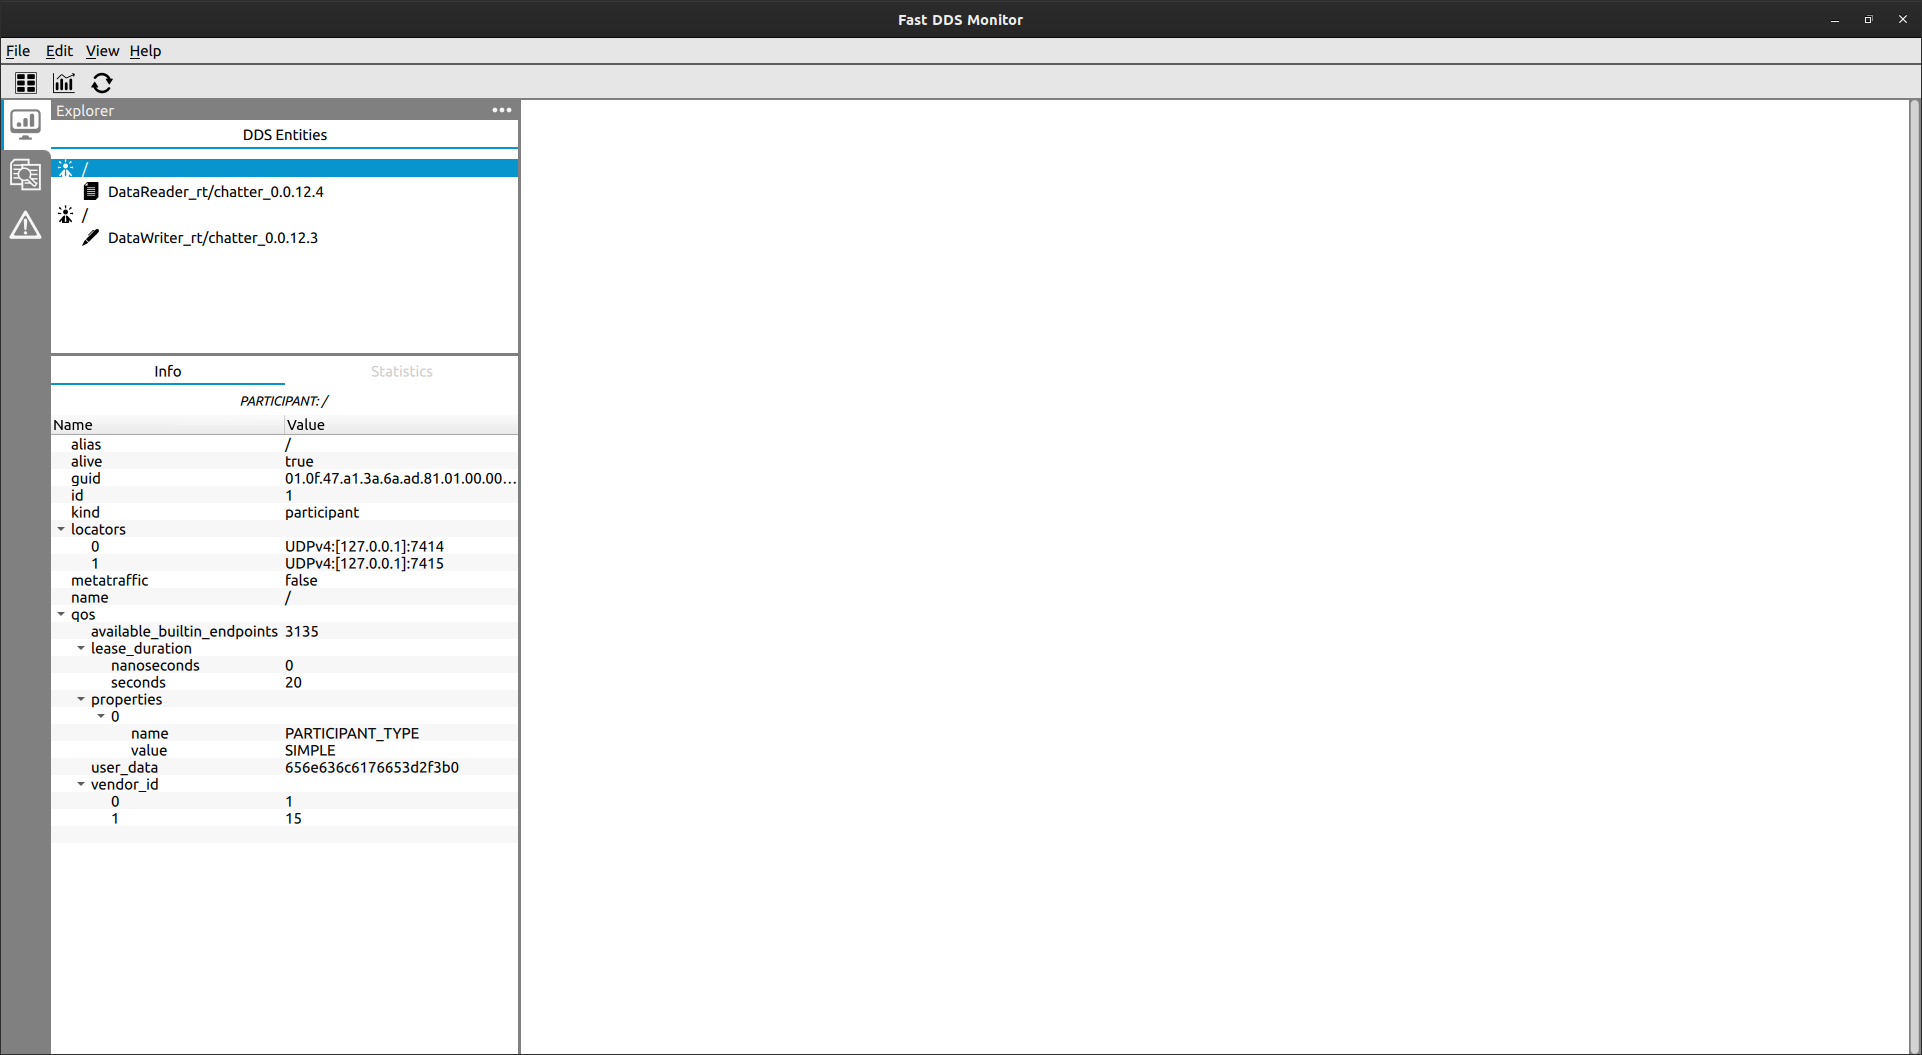
1.5.2. Physical data
In order to see the information of the host and the physical context where every node is running, go to the Explorer Pane and activate the Physical Panel. There, the host, user and process of each node are displayed.
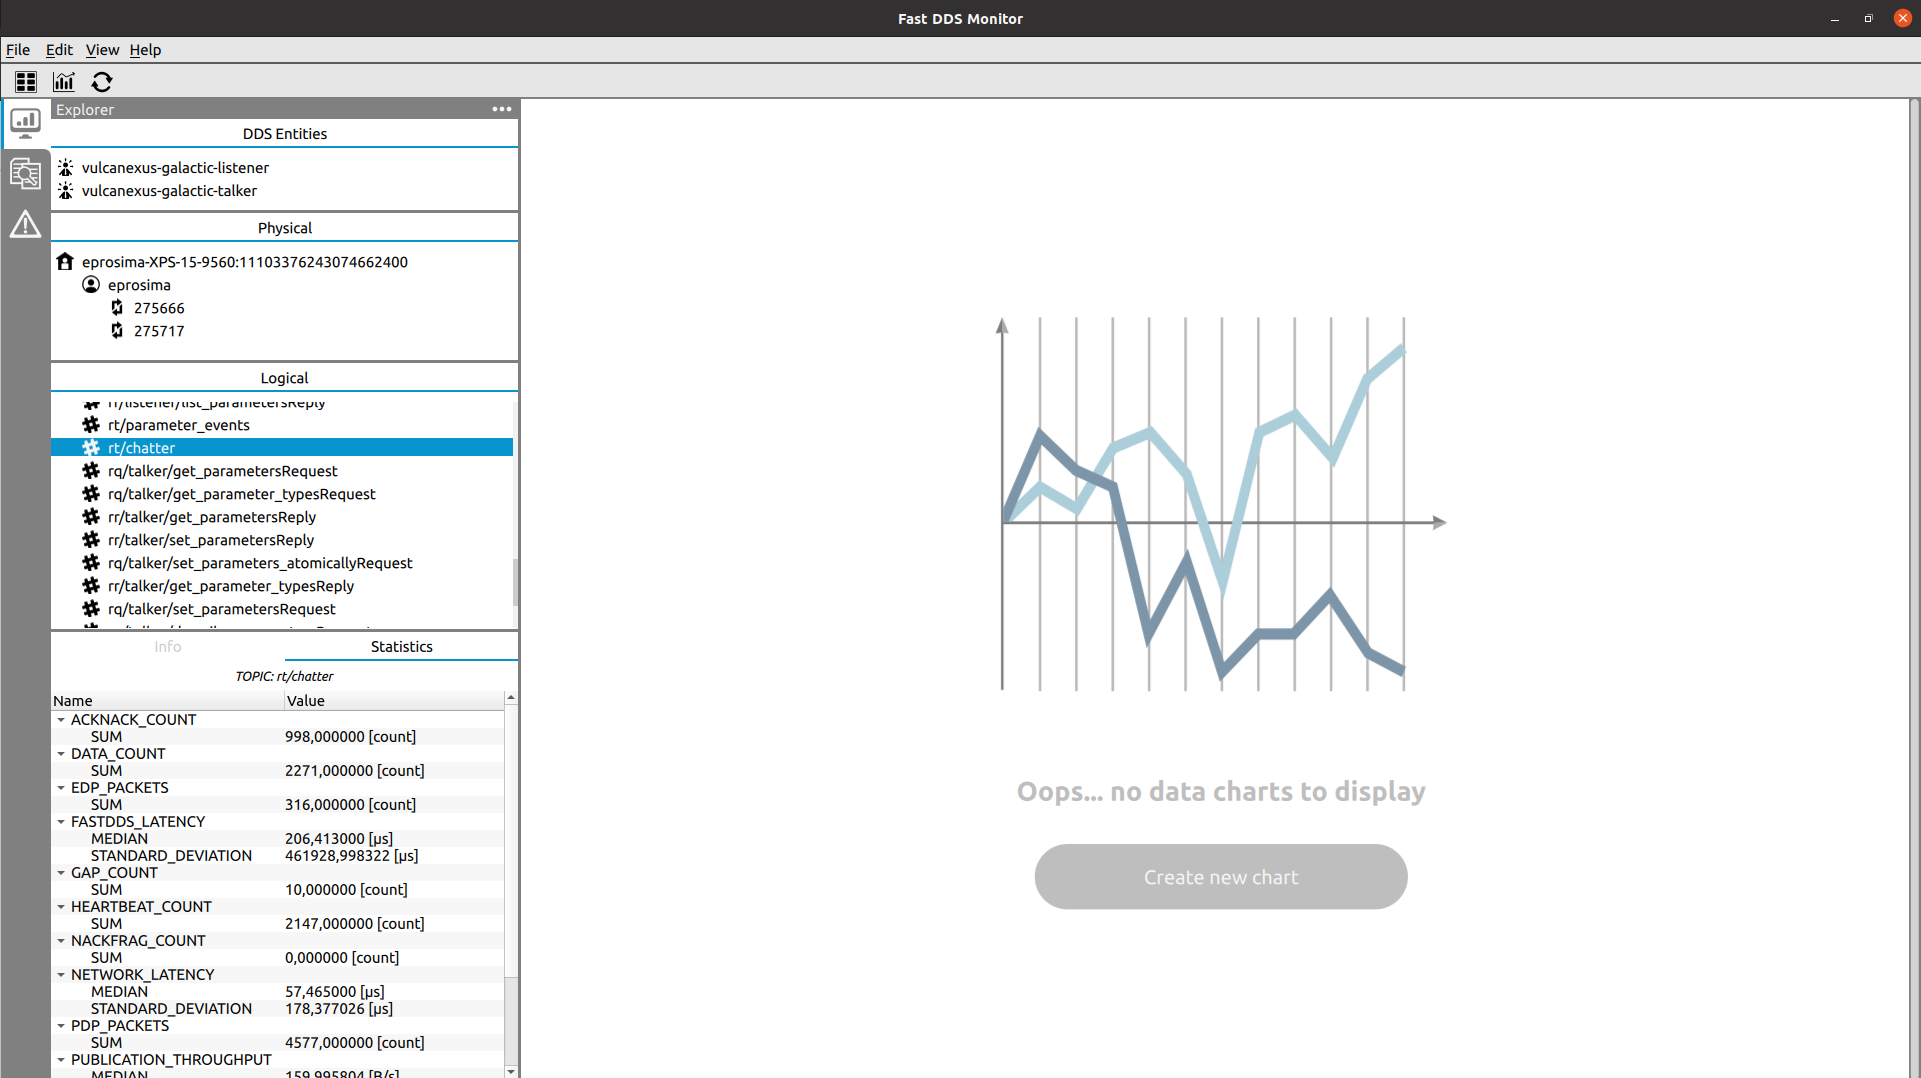
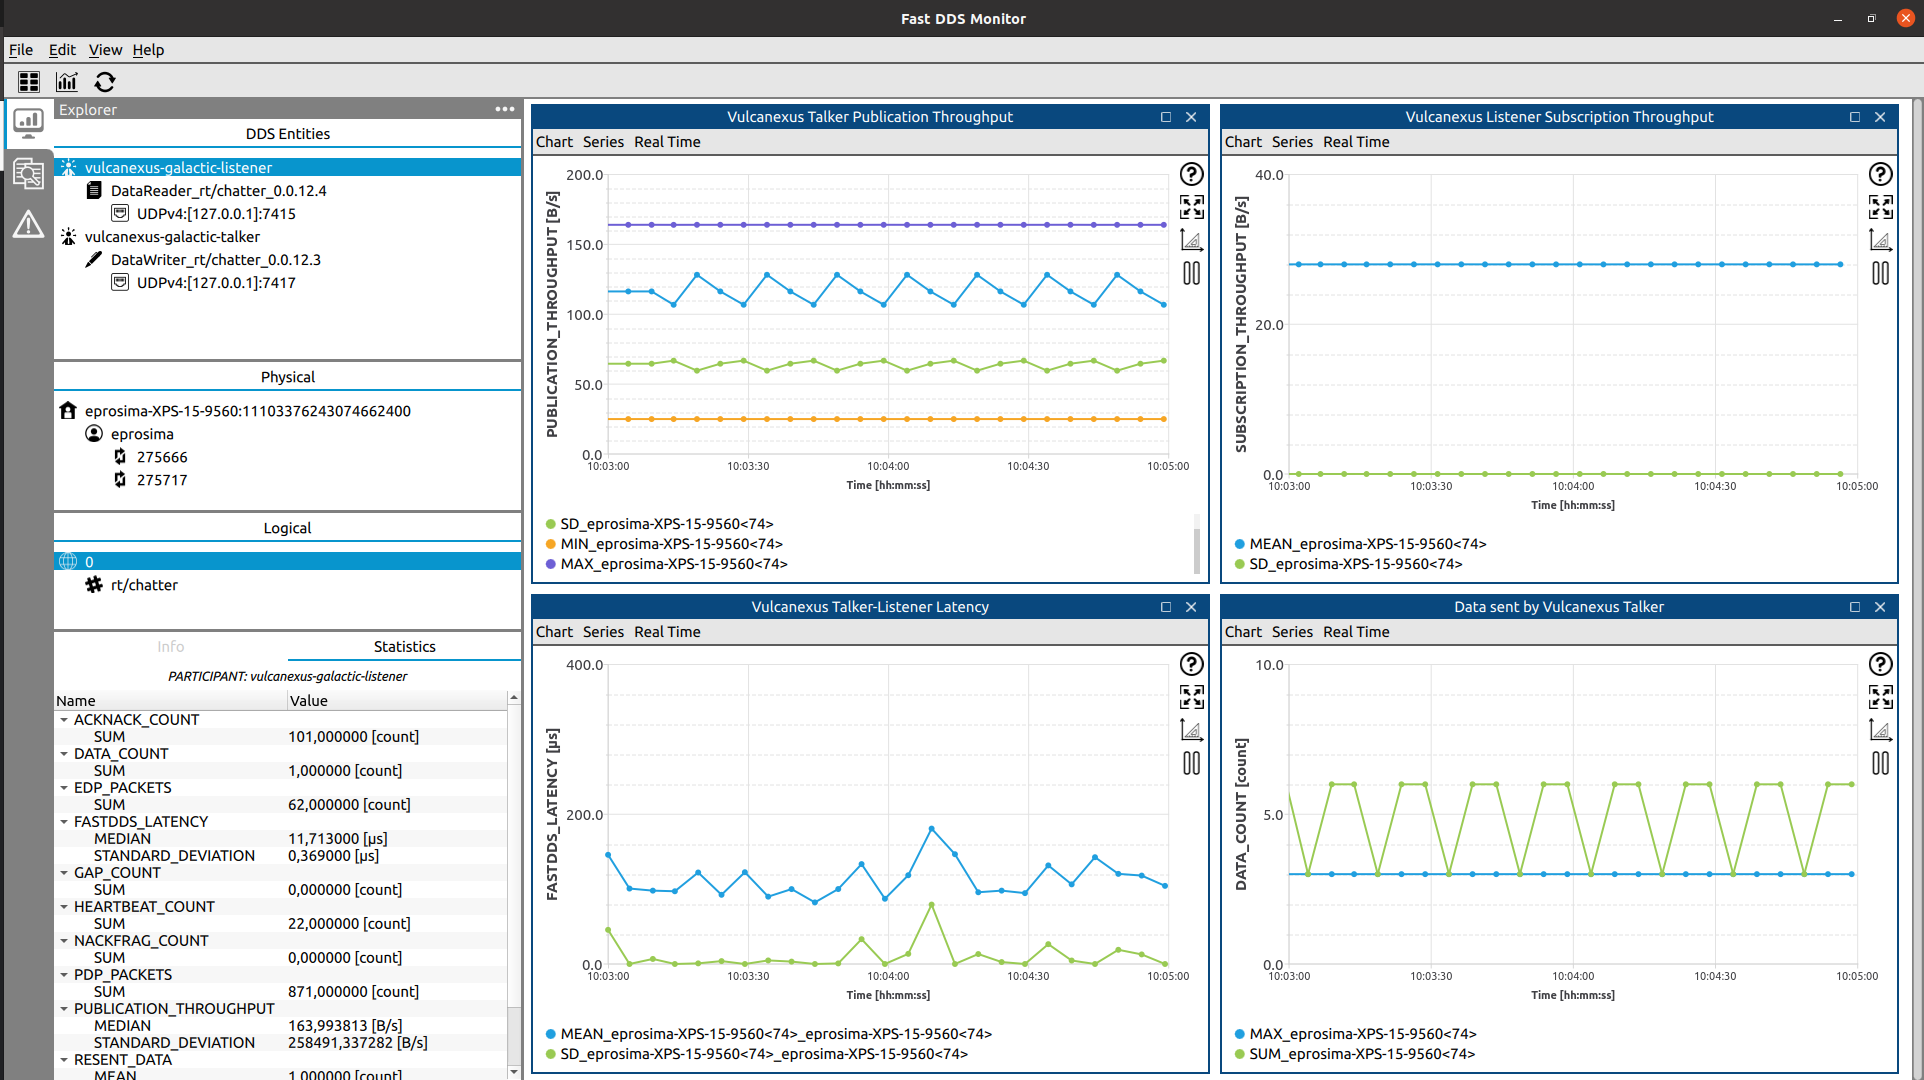
1.5.3. Statistical data
To show statistical data about the communication between the vulcanexus-galactic-talker and the vulcanexus-galactic-listener, follow the steps to create dynamic series chart.
1.5.4. Introspect metatraffic topics
Fast DDS Monitor filters by default the topics used for sharing metatraffic, as well as the endpoints related to them, so users can inspect their network easily.
These topics are the ones that ROS 2 uses for discovery and configuration purposes, such as ros_discovery_info, as well as those used by Fast DDS to report statistical data.
In order to see these topics in the monitor, click View->Show Metatraffic menu button. Now, these topics are shown in the logical panel. Furthermore, the Readers and Writers associated to them are now listed under their respective Participants.