6.4. Benchmarking
This tutorial will give insight on micro-ROS benchmarking on different topics:
Memory profiling: Static, dynamic and stack.
Data throughput on different transports.
Latency between micro-ROS Client and Agent.
This tests has been performed on a Renesas EK-RA6M5 board using micro-ROS for Renesas e2 Studio build system.
6.4.1. Memory Profiling
This section will cover micro-ROS memory usage on the most basic entity types. The test on this section have been performed using the provided UDP transport with FreeRTOS + TCP as network stack.
6.4.1.1. Profiling methodology
The memory profile has been performed with the following configuration:
Reliable entities with a fixed topic size.
UDP transport (FreeRTOS + TCP).
Transport MTU: 512 B.
Micro XRCE-DDS Client history: 4 slots.
RMW History: 4 slots (Except for RMW History section).
For more information on the middleware configuration, check the Memory management tutorial.
Note
There are no differences on memory usage between different topic sizes and the reliability kind used, as the topic size plus reliability and/or middleware overhead shall fit in the static buffers pre-allocated by the program at compile-time, defined by the history configuration.
In general, the topic size will only affect data throughput as it is directly related to the size of the messages exchanged by the middleware.
Meanwhile, to measure the different types of memory:
Static memory: The static memory has been calculated as the difference between the memory occupied by the .bss and .data sections with a non-zero number of entities, and the memory occupied by the same sections when no micro-ROS application is running, that is, the memory occupied by the rest of components of the RTOS and libraries.
Stack memory: The stack consumed during the program execution is taken into account by means of a FreeRTOS specific function involved in the memory management capabilities offered by this RTOS, the uxTaskGetStackHighWaterMark() function. This function returns the amount of stack that remains unused when the stack consumed by the program is at its greatest value. By subtracting this figure to the total stack available, which is known, one can obtain the stack peak used by the app.
Dynamic Memory: This is the memory dynamically allocated by the program by calls to
calloc()andmalloc()functions in the C language. The call to dynamic memory have been override with custom memory allocators to measure the total requested memory.
6.4.1.2. Pub/Sub applications
Publishers and subscribers have been tested varying the RMW_UXRCE_MAX_SUBSCRIPTIONS and DRMW_UXRCE_MAX_PUBLISHERS configuration between 1, 5 and 10. The entities are then initialized and used as usual on a std_msgs/msg/Int32 topic.
Note
Notice that each of these entities has its own associated topic, concluding that the number of topics used does not impact memory usage.
The total memory (static plus stack plus dynamic) occupied is summarized in the plots below:
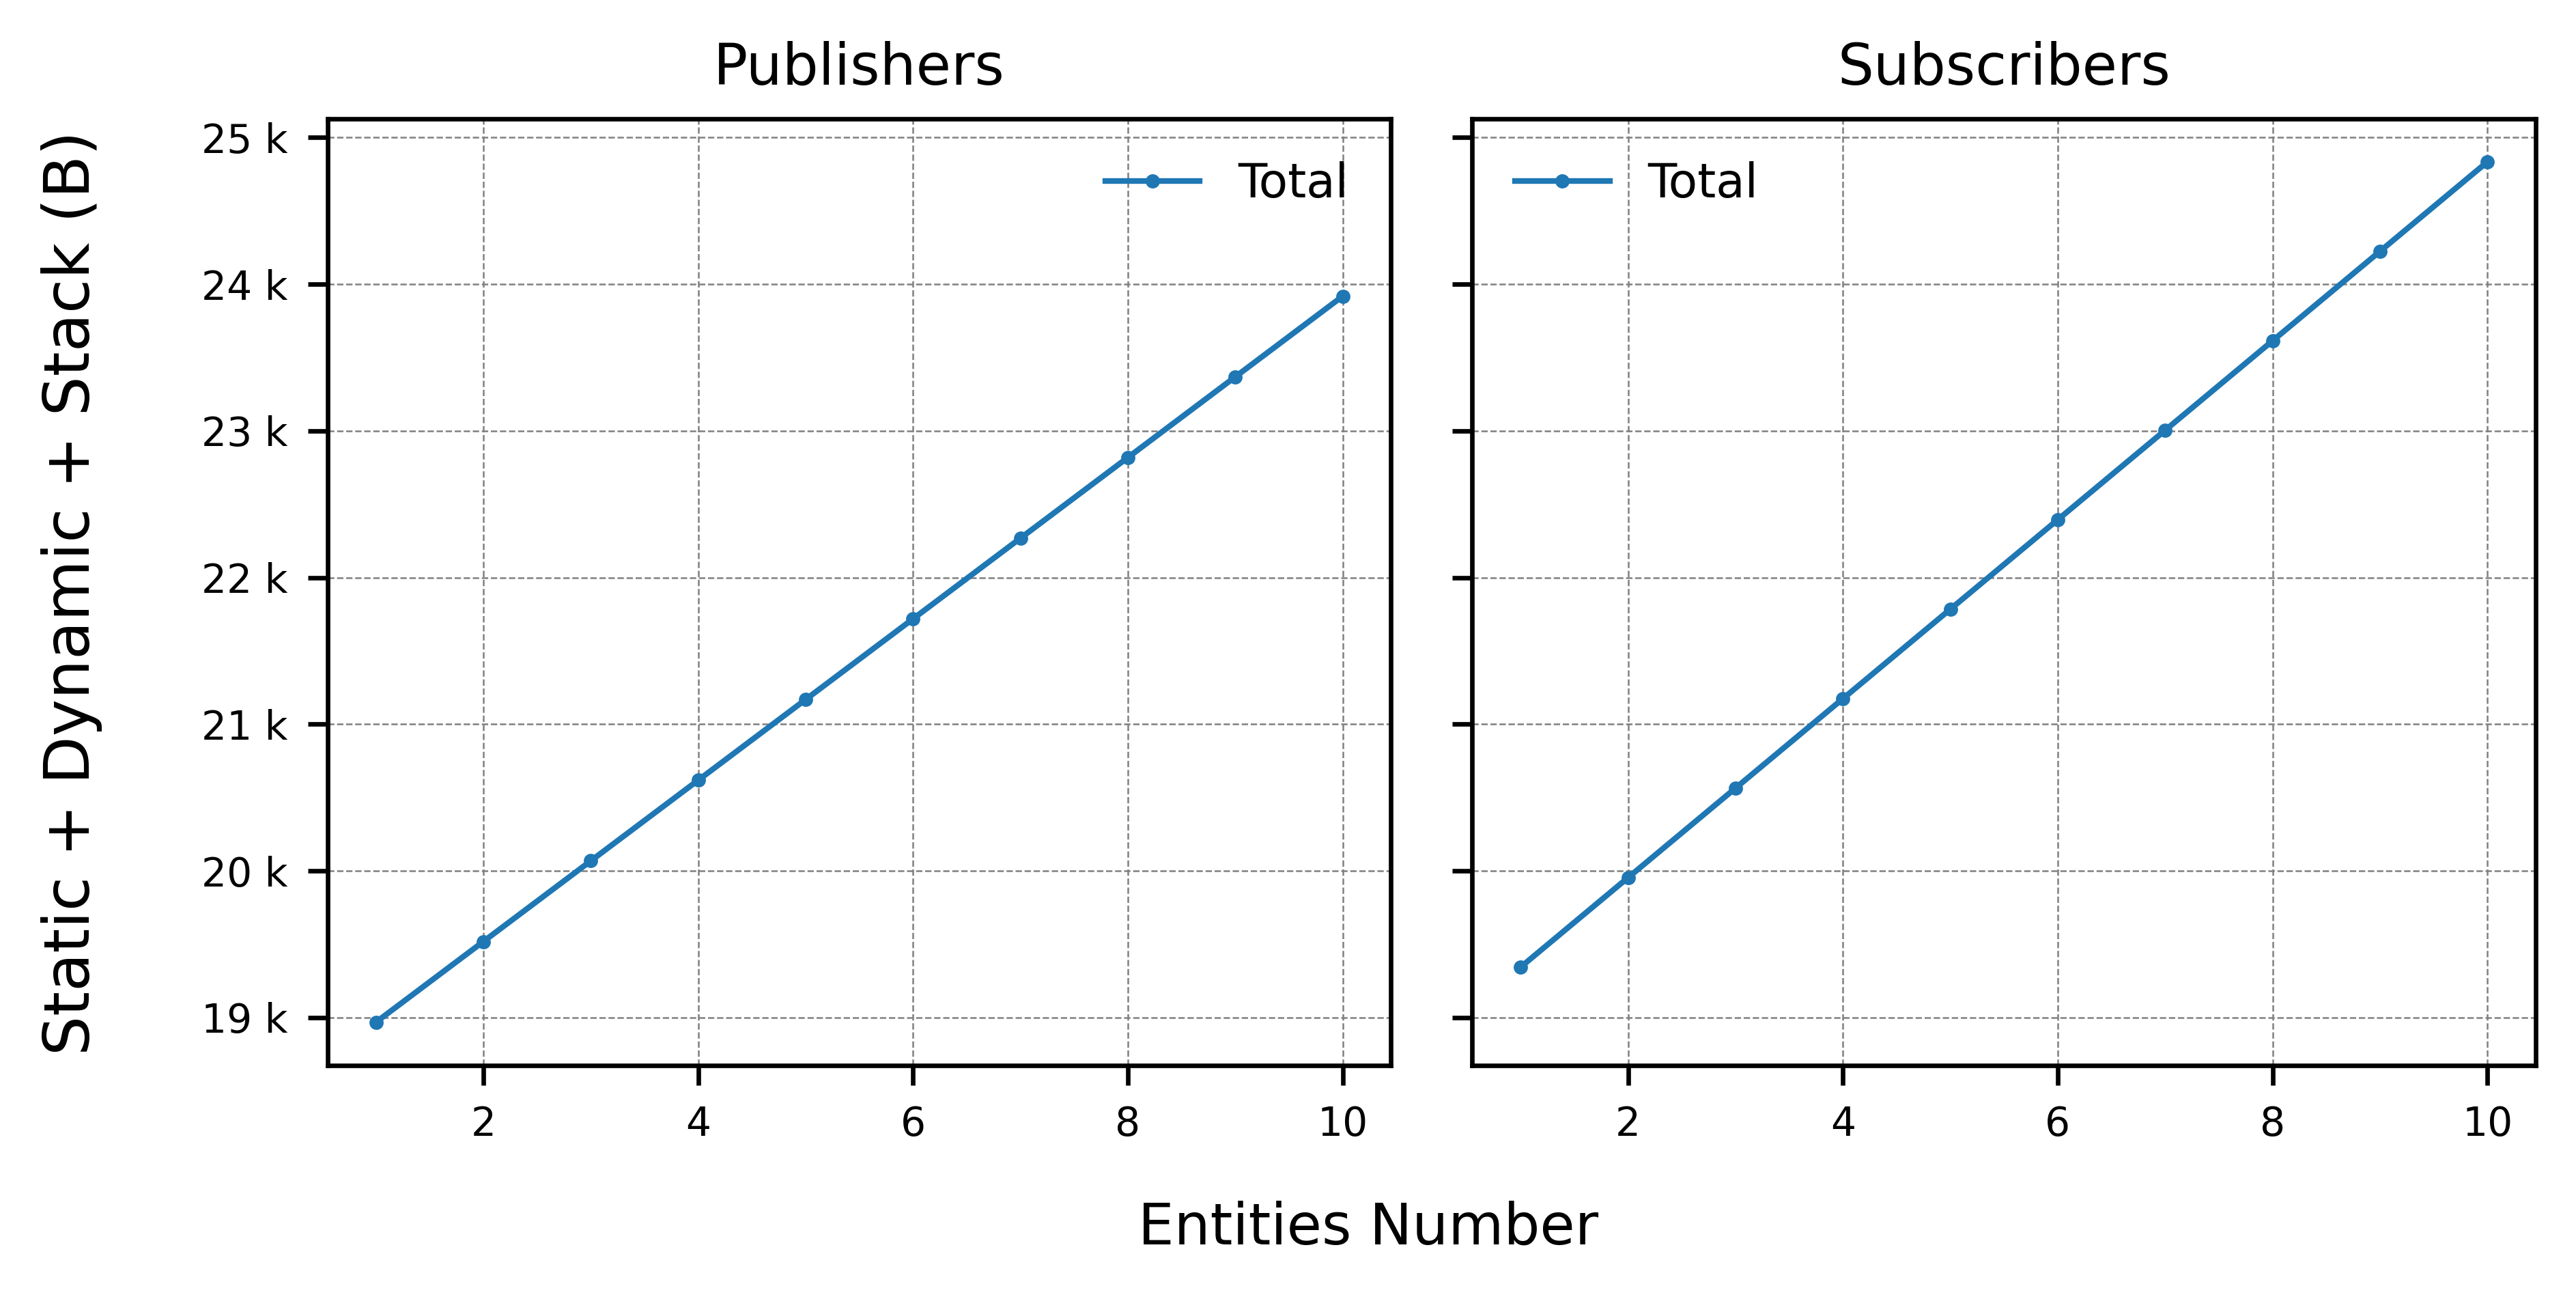
From this data, its concluded that a publisher takes a total of ~ 550 B meanwhile a subscriber uses ~ 600 B. There is virtually no difference between these two entities, as the memory pools of micro-ROS RMW are shared among all the entities participating in a given application.
To get a better understanding of the memory usage, the same is provided data but broken down into its the different memory types used:
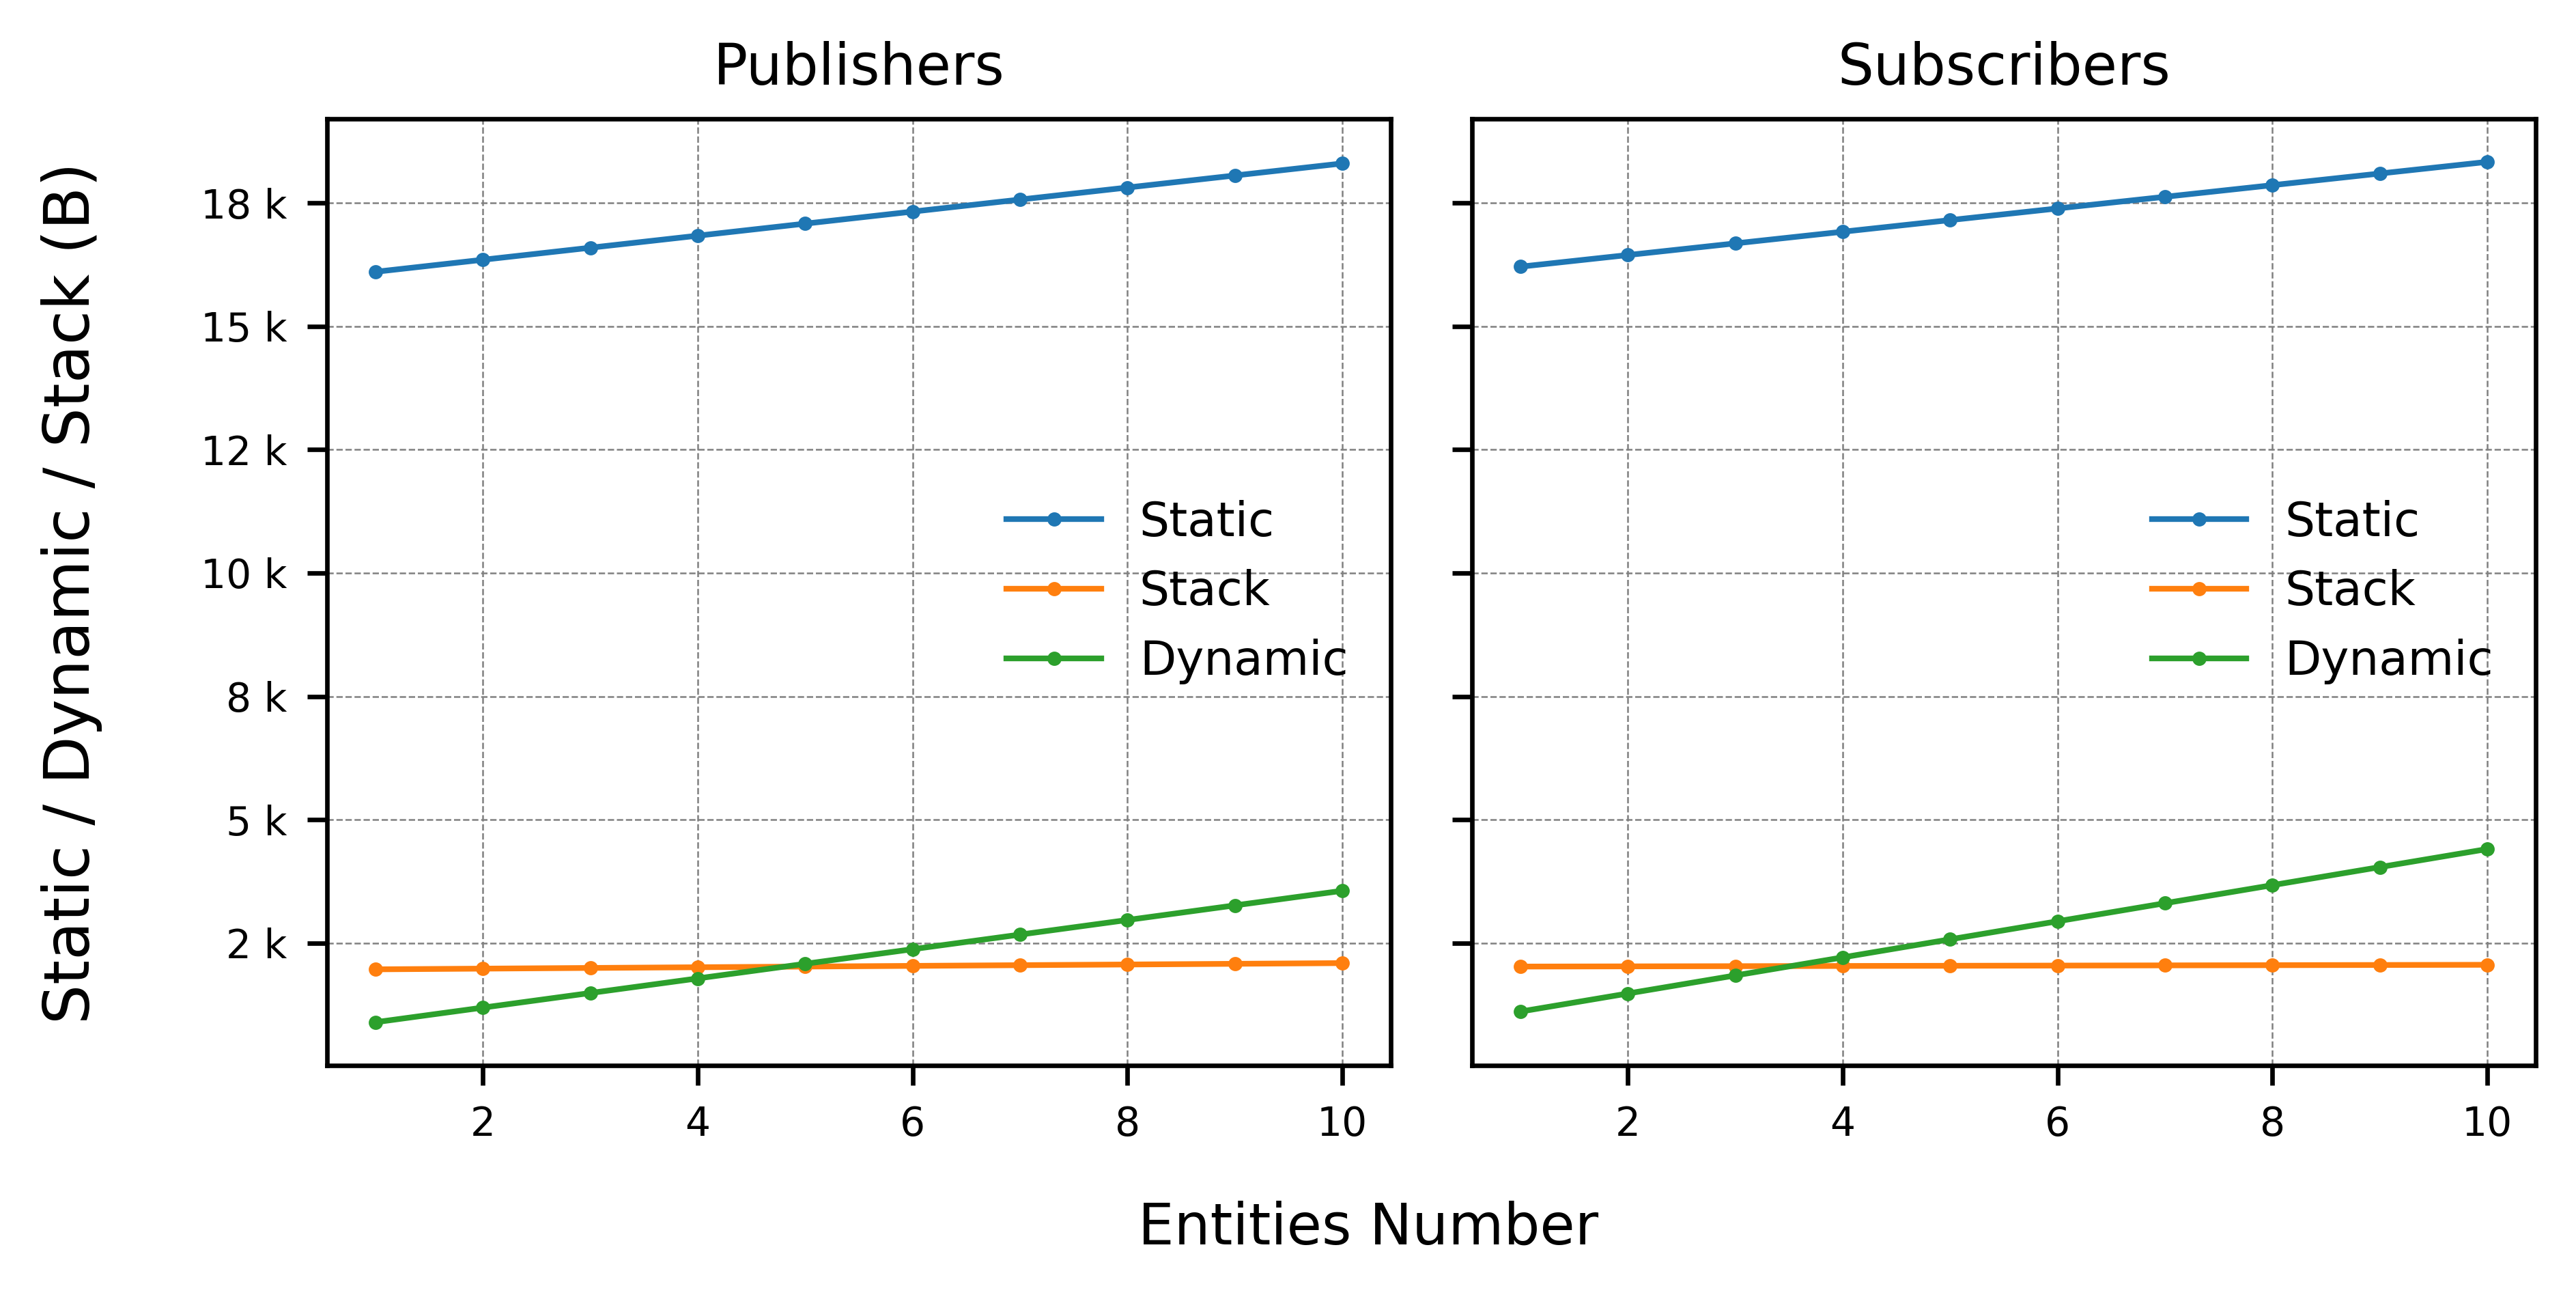
This shows that both the static and the dynamic memories change with the entity number, while the stack usage stays constant.
6.4.1.3. Service/Client applications
The same approach is used to measure service and clients applications for a example_interfaces/srv/AddTwoInts service kind.
Notice that this time the total memory is shown along its individual types:
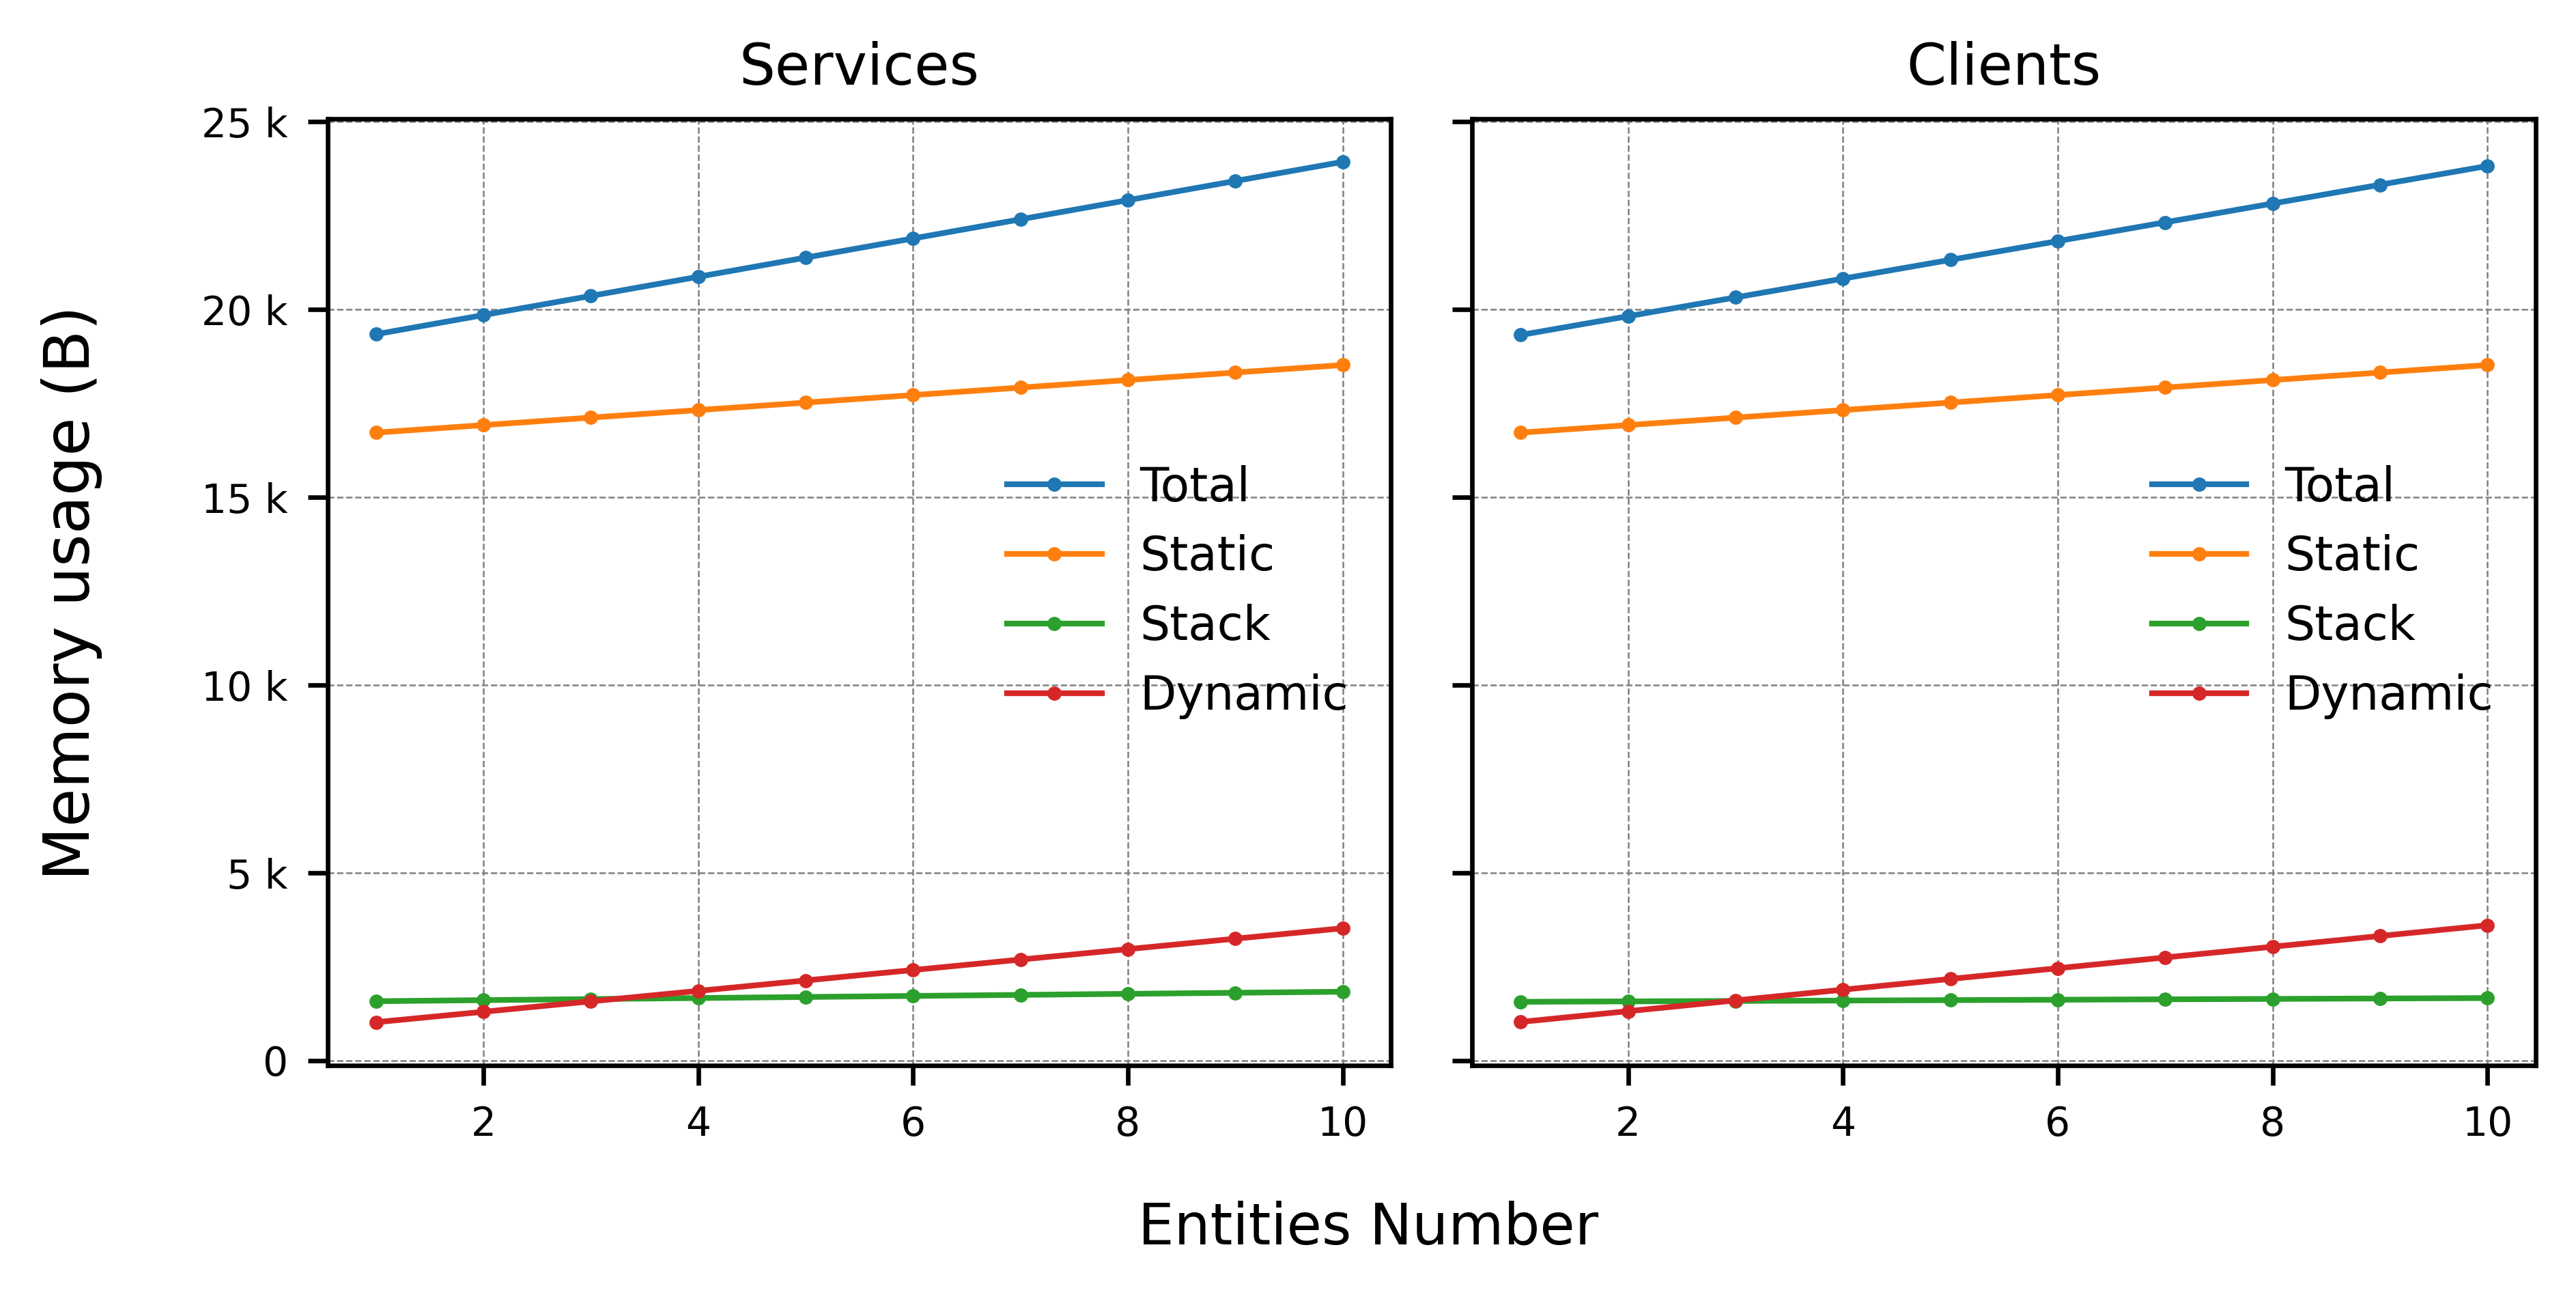
As concluded on the previous section, the memory used is almost identical for a ~ 500 B usage by both entity kinds. Note that it is also virtually identical to the memory used by a publisher or subscriber application.
6.4.1.4. RMW History
As explained before, the topic memory comes from the RMW history, which is formed by static memory pools defined on compilation time.
For a varying RMW_UXRCE_MAX_HISTORY between 1 and 10:
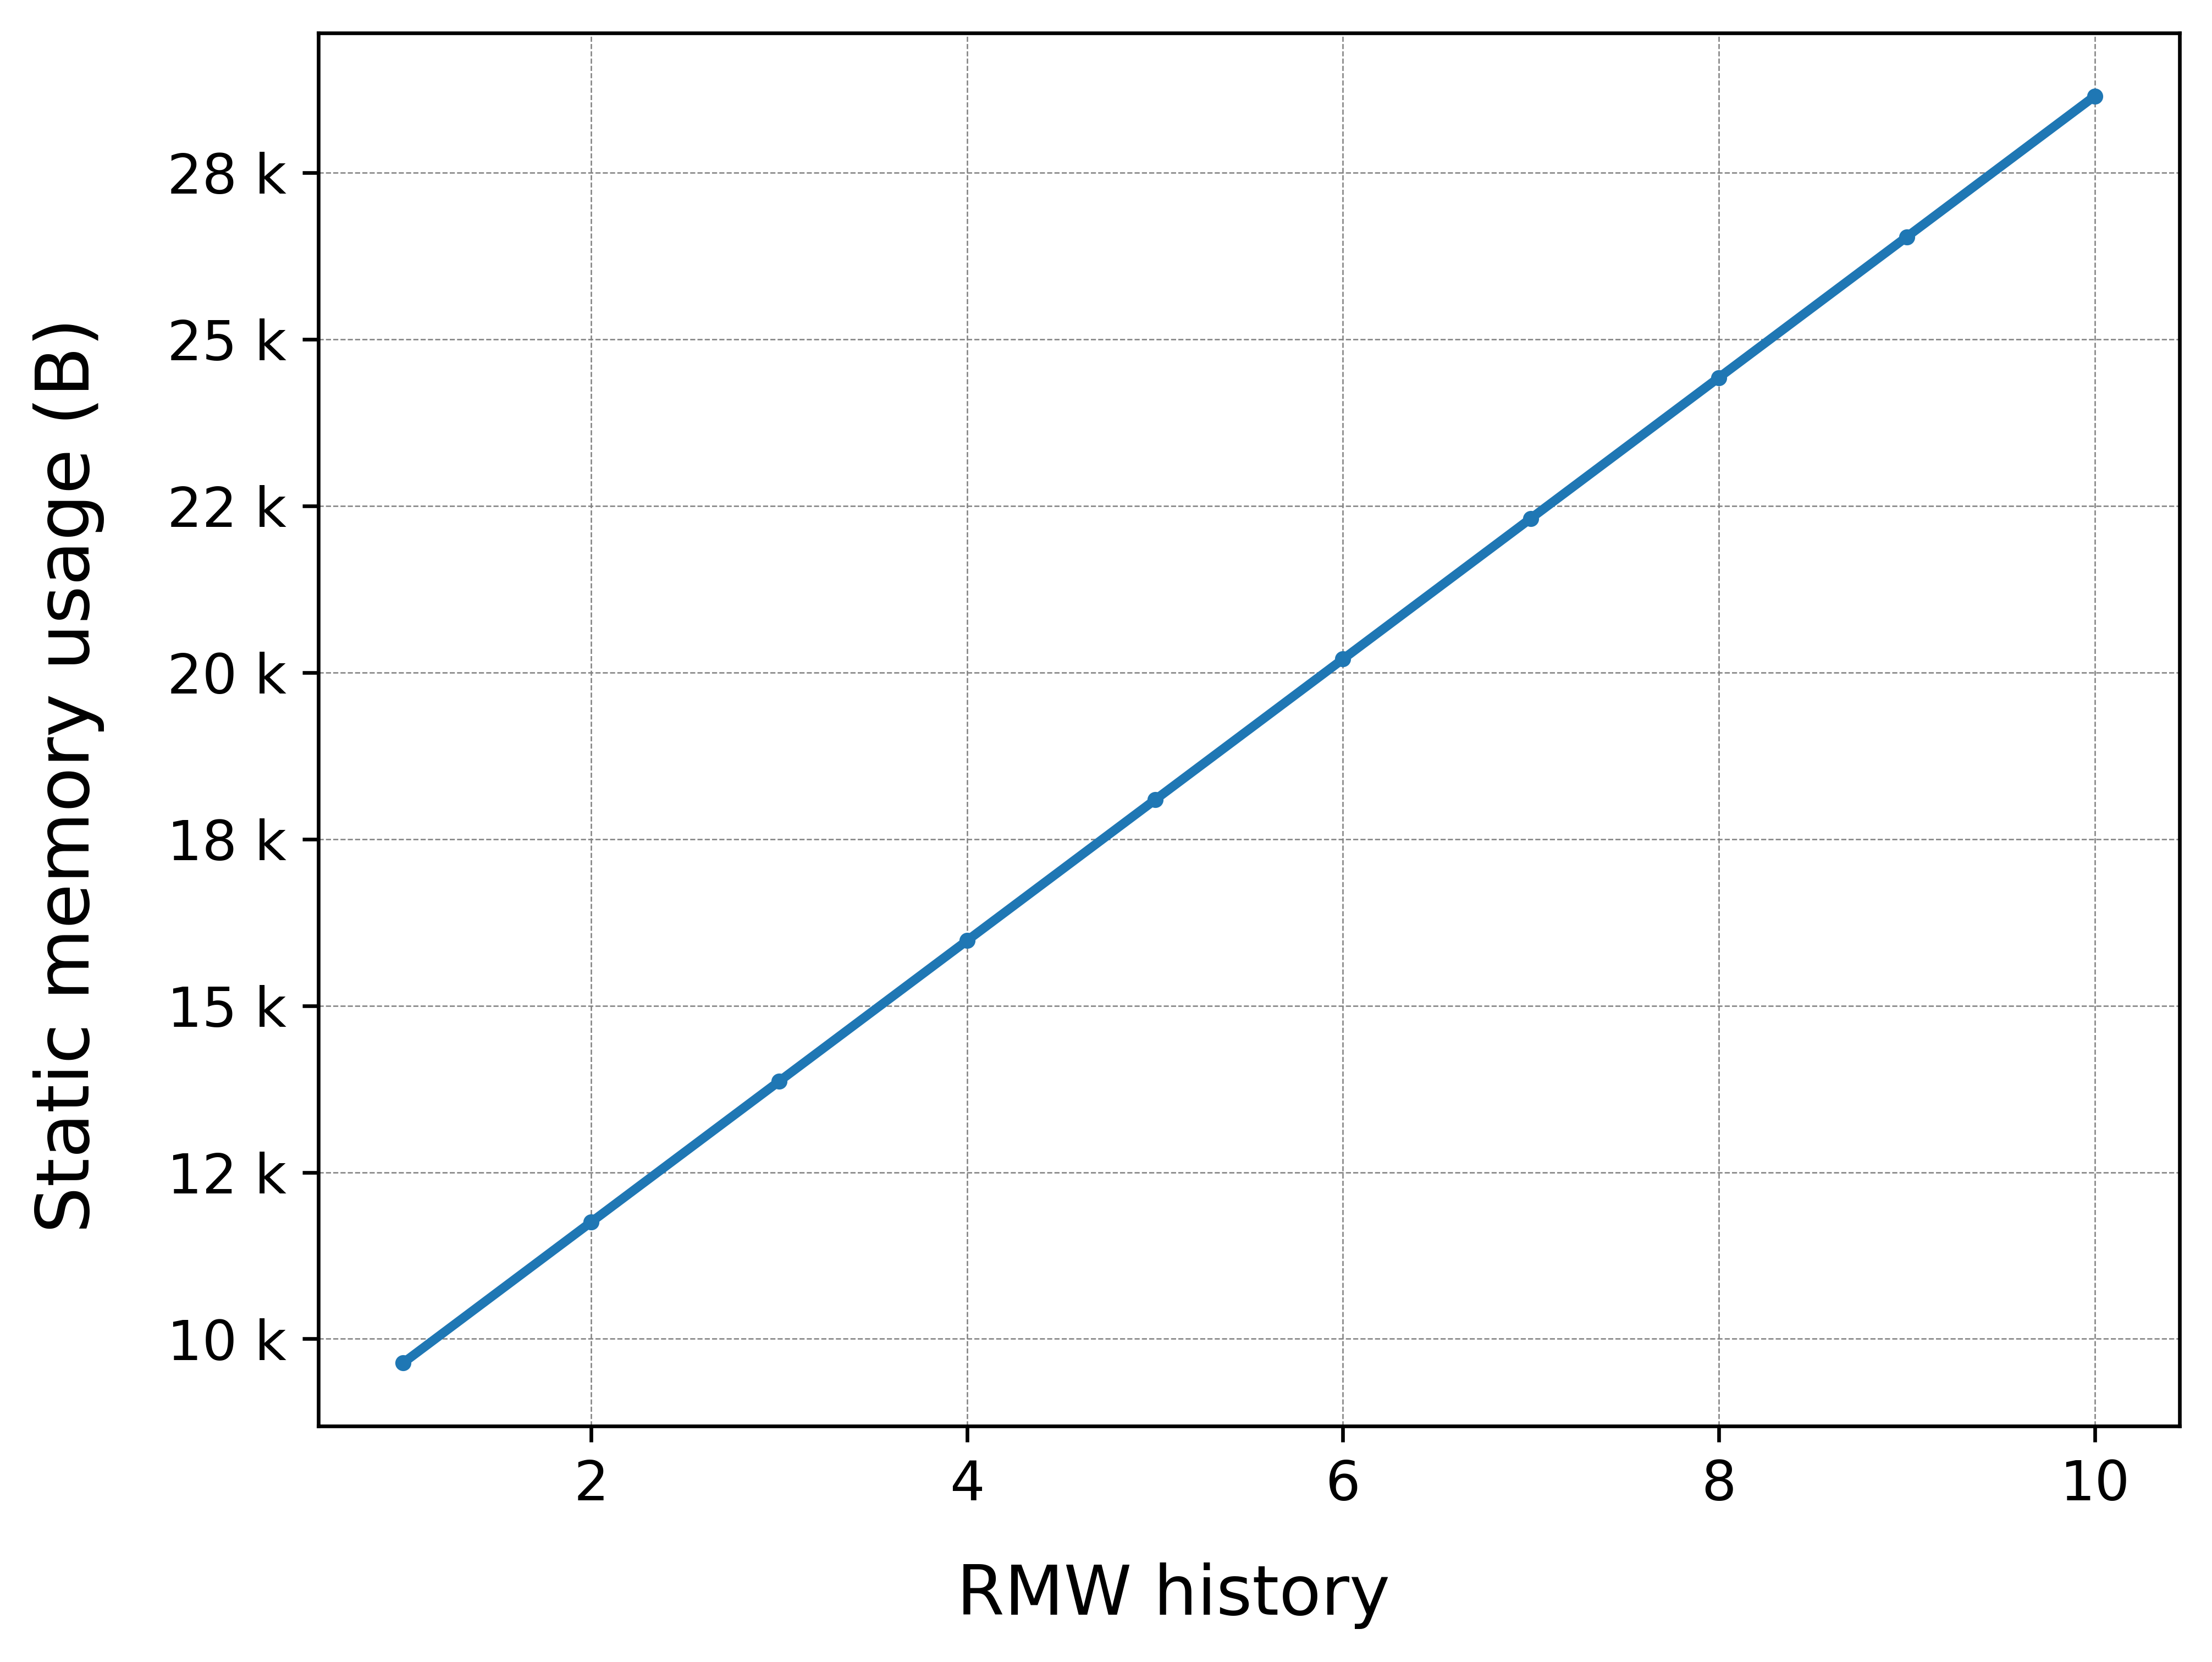
As expected, the static memory used by each history slot equals the MTU * RMW_UXRCE_STREAM_HISTORY formula, which for this scenario: 512 * 4 = 2048 B. For more details on the middleware memory usage, check the Memory management tutorial.
6.4.2. Throughput
On this section data throughput will be measured for different transports and topic sizes. To perform this test, a simple best effort publisher micro-ROS application sends variable std_msgs/msg/String for 5 seconds.
The transport are divided based on their framing configuration. More details can be found on the Custom Transports tutorial.
6.4.2.1. Stream-oriented transports
The tested stream oriented transports and their configuration are:
USB-CDC: 115200 bauds per second.
Serial UART: 115200 bauds per second.
TCP (AWS Secure Sockets) based on Wi-Fi-Pmod-Expansion-Board.
PMOD: 460800 bauds per second.
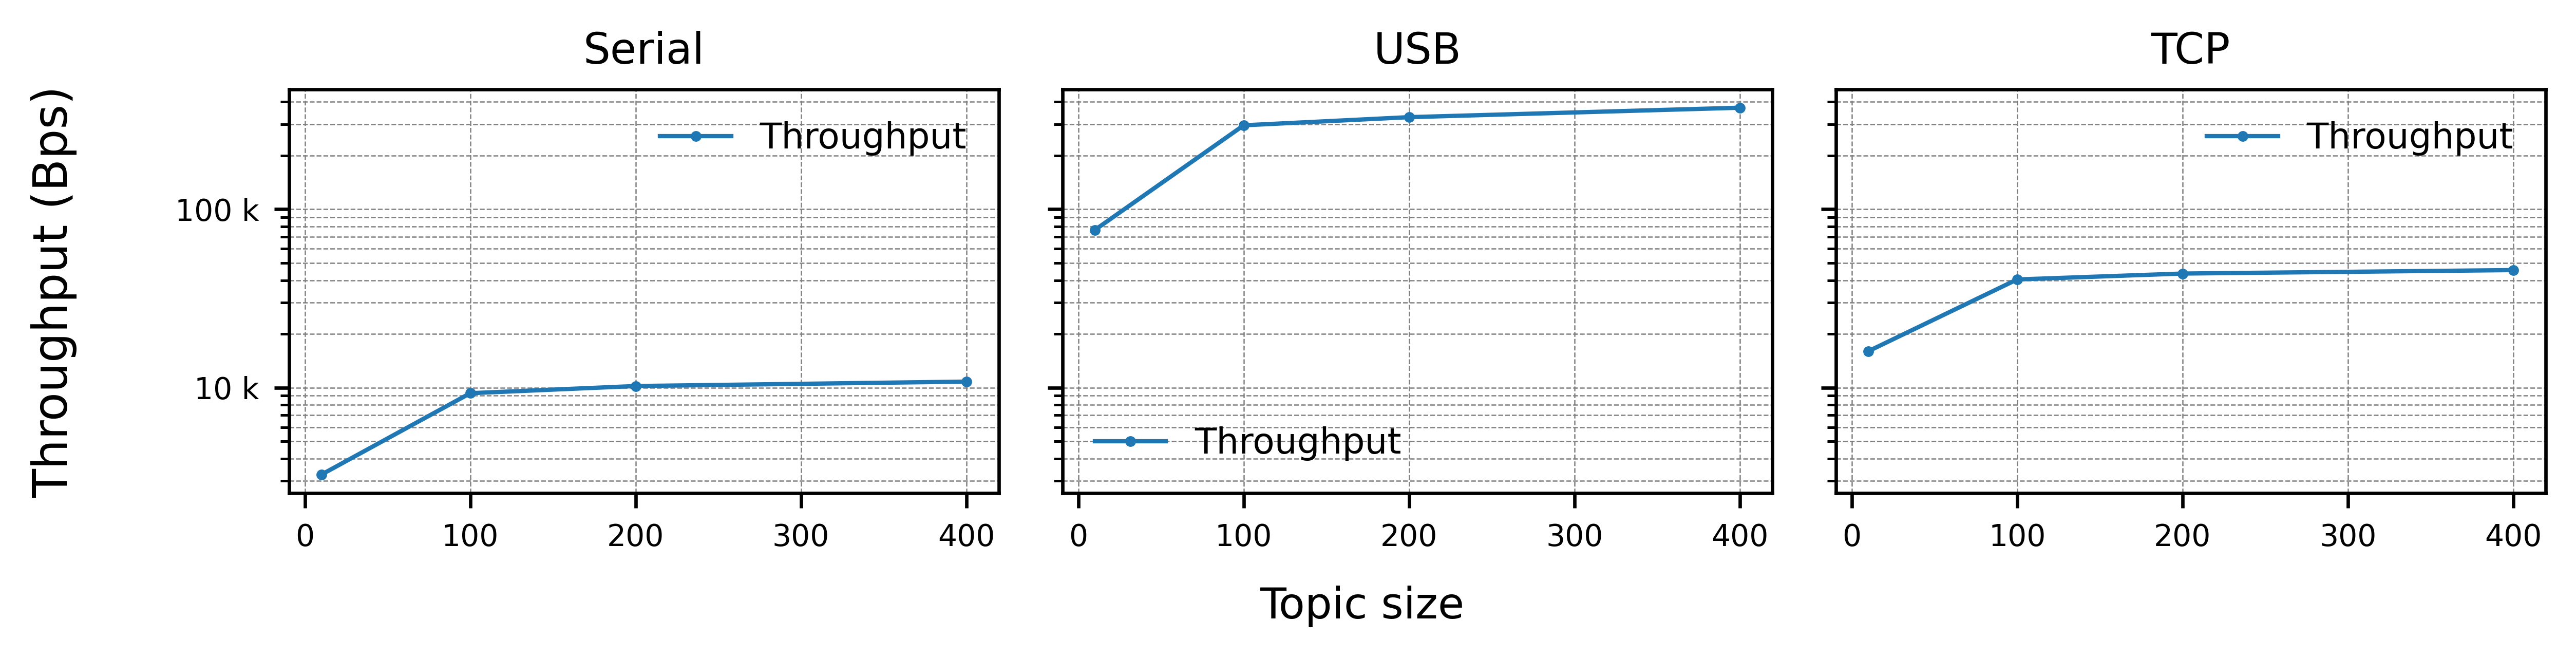
As expected, USB shows the higher throughput due to the fact that has the higher bandwidth, followed by TCP over WiFi and Serial. There is also a great improvement on the throughput as the payload is increased, caused by the overhead added by the HDLC framing protocol.
6.4.2.2. Packet-oriented transports
As for packet oriented transports, the following have been tested:
CAN-FD using a PCAN-USB FD adapter.
Nominal rate: 0.5 Mbps
Data rate: 2 Mbps
UDP (FreeRTOS + TCP) over cable.
UDP (ThreadX + NetX) over cable.
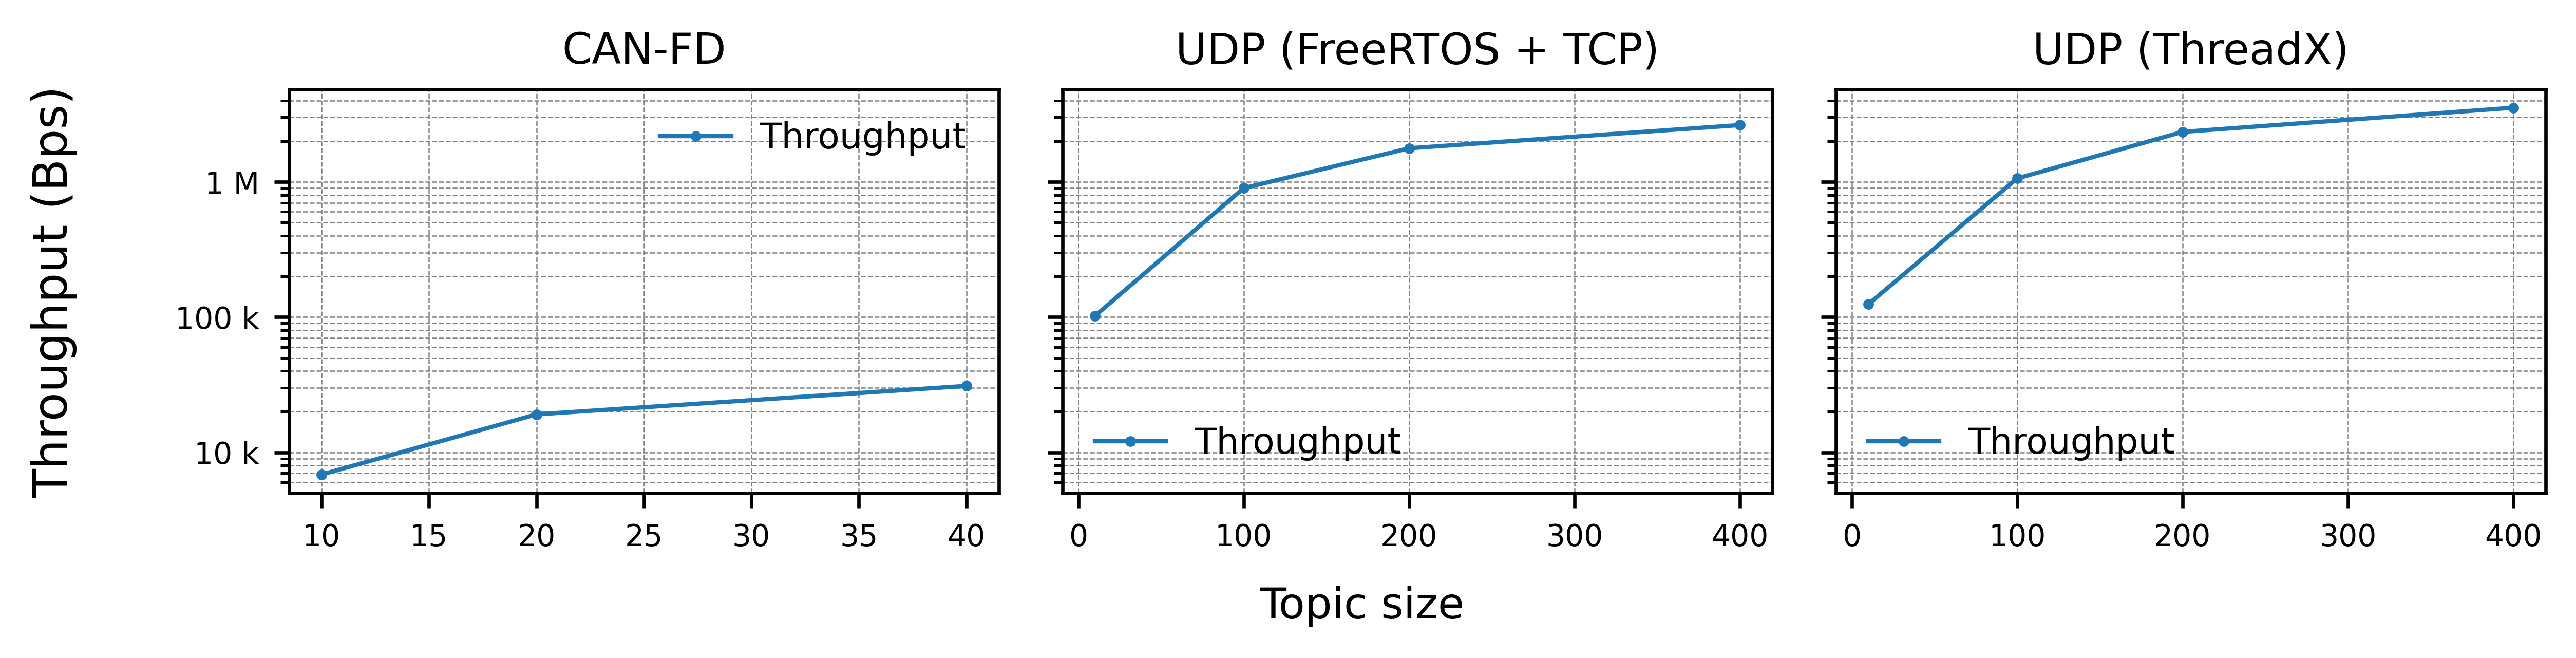
This data shows how variable is micro-ROS data throughput regarding the used RTOS and network stack, as there is a clear difference between UDP using FreeRTOS + TCP and NetX. Its also clear that the throughput in this case is linear with the topic size, avoiding performance differences as in the previous section.
Note
As CAN-FD protocol has a maximum payload of 64 bytes, the topic size used has been adjusted to the available RMW History parameter.
6.4.3. Latency
Latency and round trip time (RTT) has been measured with a pub/sub application were timestamps are exchanged using std_msgs/msg/Int64 messages.
To calculate the results, the timestamp of the board is synchronized with the Agent using the time synchronization API.
Transport |
Client publish time |
Agent publish time |
RTT |
|---|---|---|---|
CAN-FD |
1.29 ms |
2.41 ms |
3.70 ms |
USB-CDC |
1.09 ms |
1.45 ms |
2.55 ms |
Serial UART |
3.77 ms |
5.04 ms |
8.81 ms |
UDP (ThreadX + NetX) |
0.54 ms |
0.72 ms |
1.26 ms |
UDP (FreeRTOS + TCP) |
0.52 ms |
0.70 ms |
1.22 ms |
TCP (PMOD WiFi) |
1.55 ms |
2.04 ms |
3.59 ms |
As expected, the latency and RTT is directly related to the transport latency and throughput.