2.7. ROS 2 network statistics inspection with Prometheus
2.7.1. Background
Vulcanexus integrates ROS 2 Monitor, which is a useful tool for monitoring and studying a ROS 2 network as ROS 2 relies on the DDS specification to communicate the different nodes.
This other tutorial demonstrates how to use this powerful tool in a ROS 2 demo_nodes_cpp talker/listener scenario.
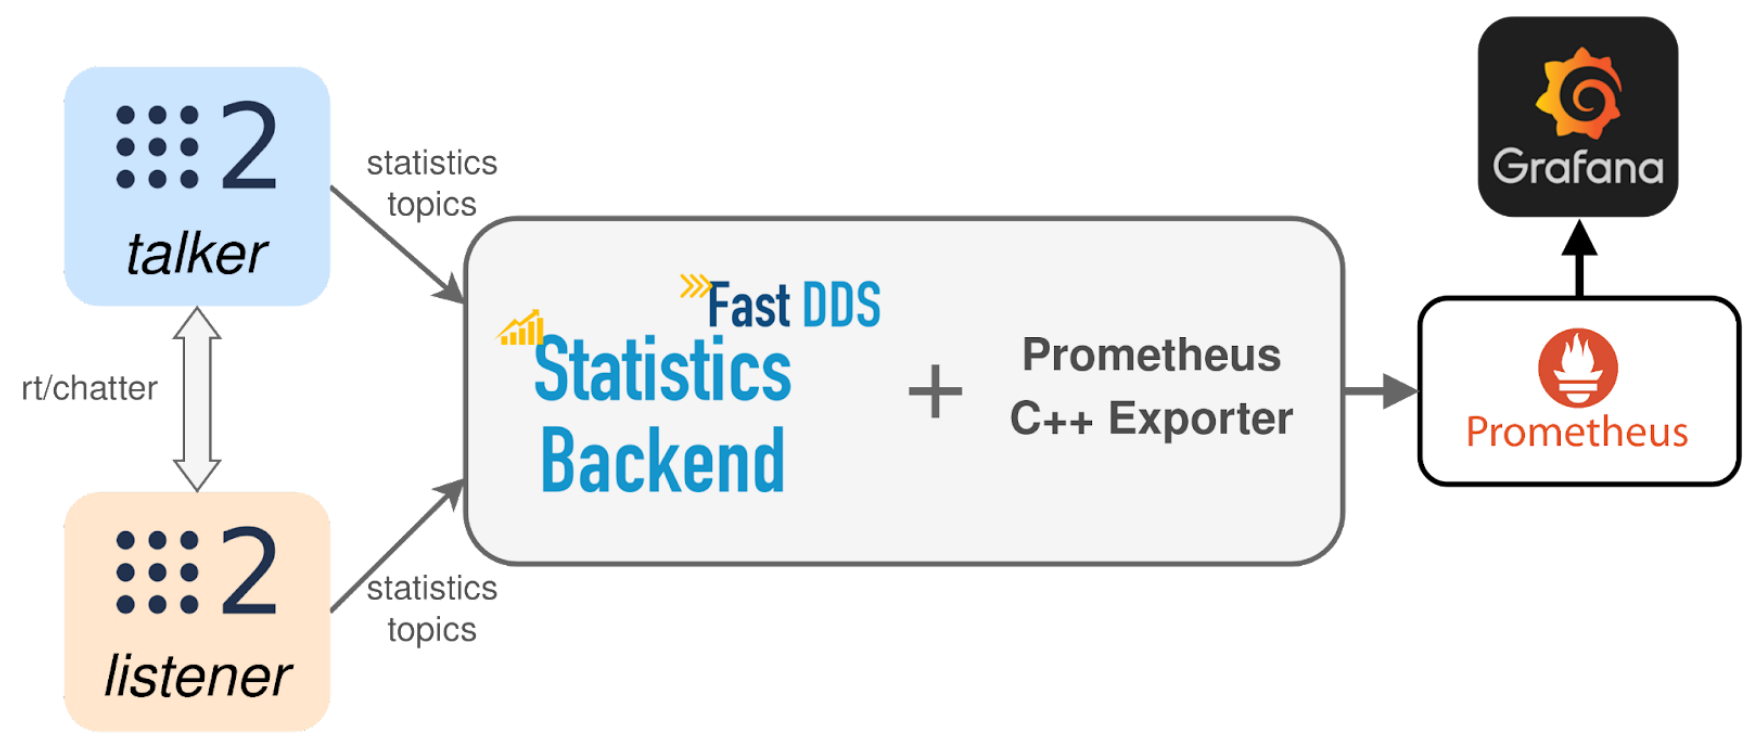
However, Vulcanexus Tools offers more possibilities when it comes to statistics visualization; ROS 2 Monitor is a frontend application relying on Fast DDS Statistics Backend, but the latter may also be leveraged with alternative visualization utilities such as Prometheus and Grafana.
This tutorial provides step-by-step instructions on how to monitor a ROS 2 talker/listener in Vulcanexus by using Fast DDS Statistics Backend along with Prometheus.
2.7.2. Prerequisites
2.7.2.1. Vulcanexus Tools
Ensure that the Vulcanexus installation includes Vulcanexus Tools (either vulcanexus-kilted-desktop, vulcanexus-kilted-tools, or vulcanexus-kilted-base).
Also, remember to source the environment in every terminal in this tutorial.
source /opt/vulcanexus/kilted/setup.bash
2.7.2.2. Prometheus exporter
Additionally, C++ Prometheus exporter is required to forward the statistical data received by the backend to Prometheus. Install this specific version of Prometheus exporter by following any of the methods described in the given link.
2.7.2.3. Prometheus
It is recommended (although not required) to install Prometheus for being able to visualize gathered statistics. If not installed, data will still be collected and visible in the terminal, but no graphs will be displayed. Follow the installation guide from the official website. The configuration file needed to replicate this demo can be found here.
2.7.2.4. Backend application
It only remains to install a simple application that, by making use of Fast DDS Statistics Backend, will collect statistical data and export it through the previously installed Prometheus exporter.
mkdir ~/Fast-DDS-statistics-backend && cd ~/Fast-DDS-statistics-backend
git clone https://github.com/eProsima/Fast-DDS-statistics-backend.git
cd ~/Fast-DDS-statistics-backend/examples/cpp/ROS2Prometheus
mkdir build && cd build
cmake .. && make
2.7.3. Execute ROS 2 demo nodes with statistics
In order to activate the publication of statistical data, eProsima Fast DDS requires an environment variable specifying which kinds of statistical data are to be reported.
Consequently, before launching the ROS 2 nodes, remember to set FASTDDS_STATISTICS environment variable.
Run the following commands in different terminals (remember to source the Vulcanexus environment):
export FASTDDS_STATISTICS="HISTORY_LATENCY_TOPIC;PUBLICATION_THROUGHPUT_TOPIC;PHYSICAL_DATA_TOPIC"

ros2 run demo_nodes_cpp listener
export FASTDDS_STATISTICS="HISTORY_LATENCY_TOPIC;PUBLICATION_THROUGHPUT_TOPIC;PHYSICAL_DATA_TOPIC"

ros2 run demo_nodes_cpp talker
2.7.4. Launch backend application
Once communication between the talker and listener has been established, launch the application for gathering and exporting statistical data to Prometheus.
cd ~/Fast-DDS-statistics-backend/examples/cpp/ROS2Prometheus/build
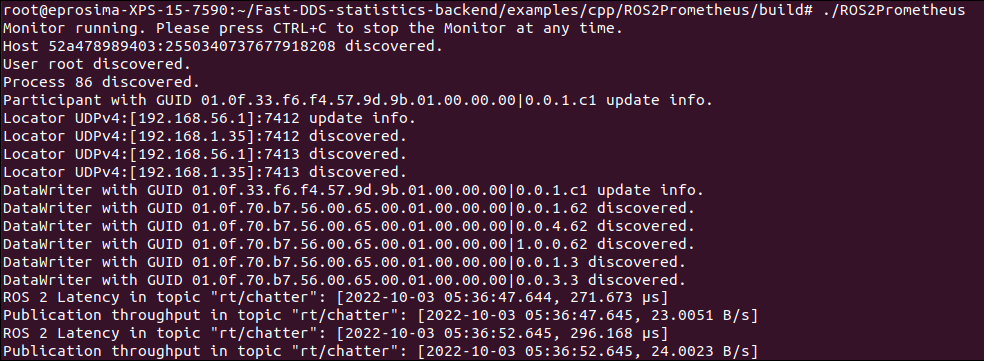
./ROS2Prometheus
Traces showing the latency and publication throughput should be visible on screen, with an update period of 5 seconds.
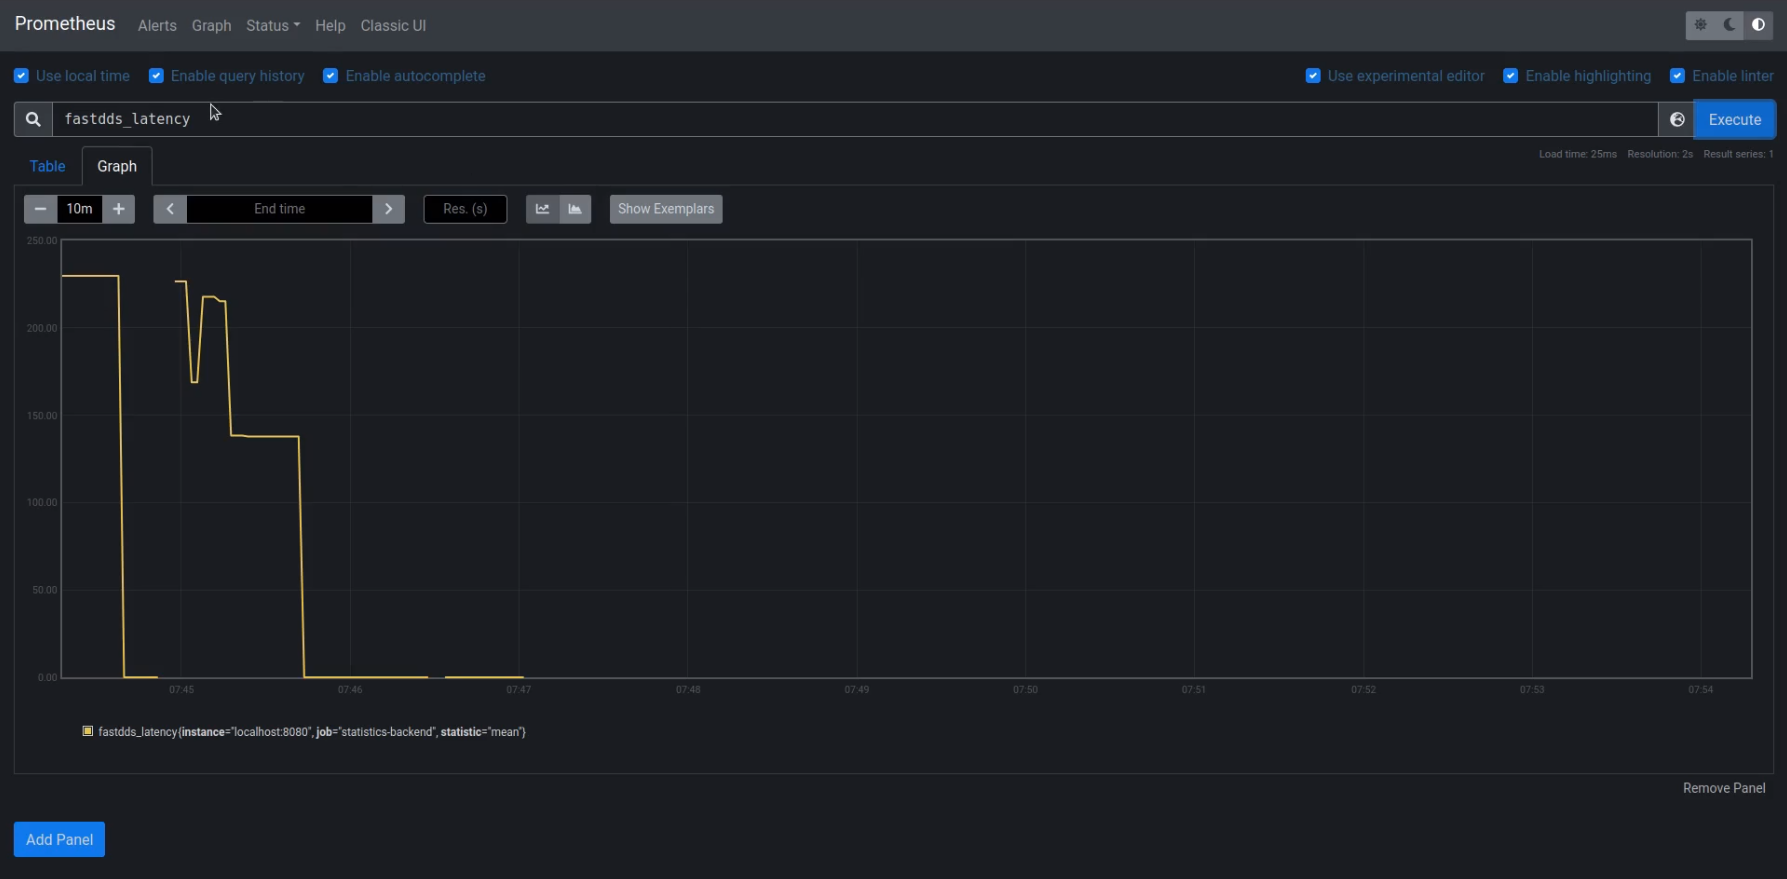
2.7.5. Visualizing with Prometheus
Launch Prometheus with the given configuration file and create a graph for each of the metrics exported (fastdds_latency and publication_throughput).
cd prometheus-install-path
./prometheus --config.file=prometheus.yml
xdg-open http://localhost:9090
Note
If running Vulcanexus in Docker containers, and if Prometheus has been installed in the host’s system, it is required to pass --net=host argument to the backend application container in order to enable communication between them.
Prometheus is a versatile open source monitoring system offering seamless interoperability with other analytics and visualization applications such as Grafana.
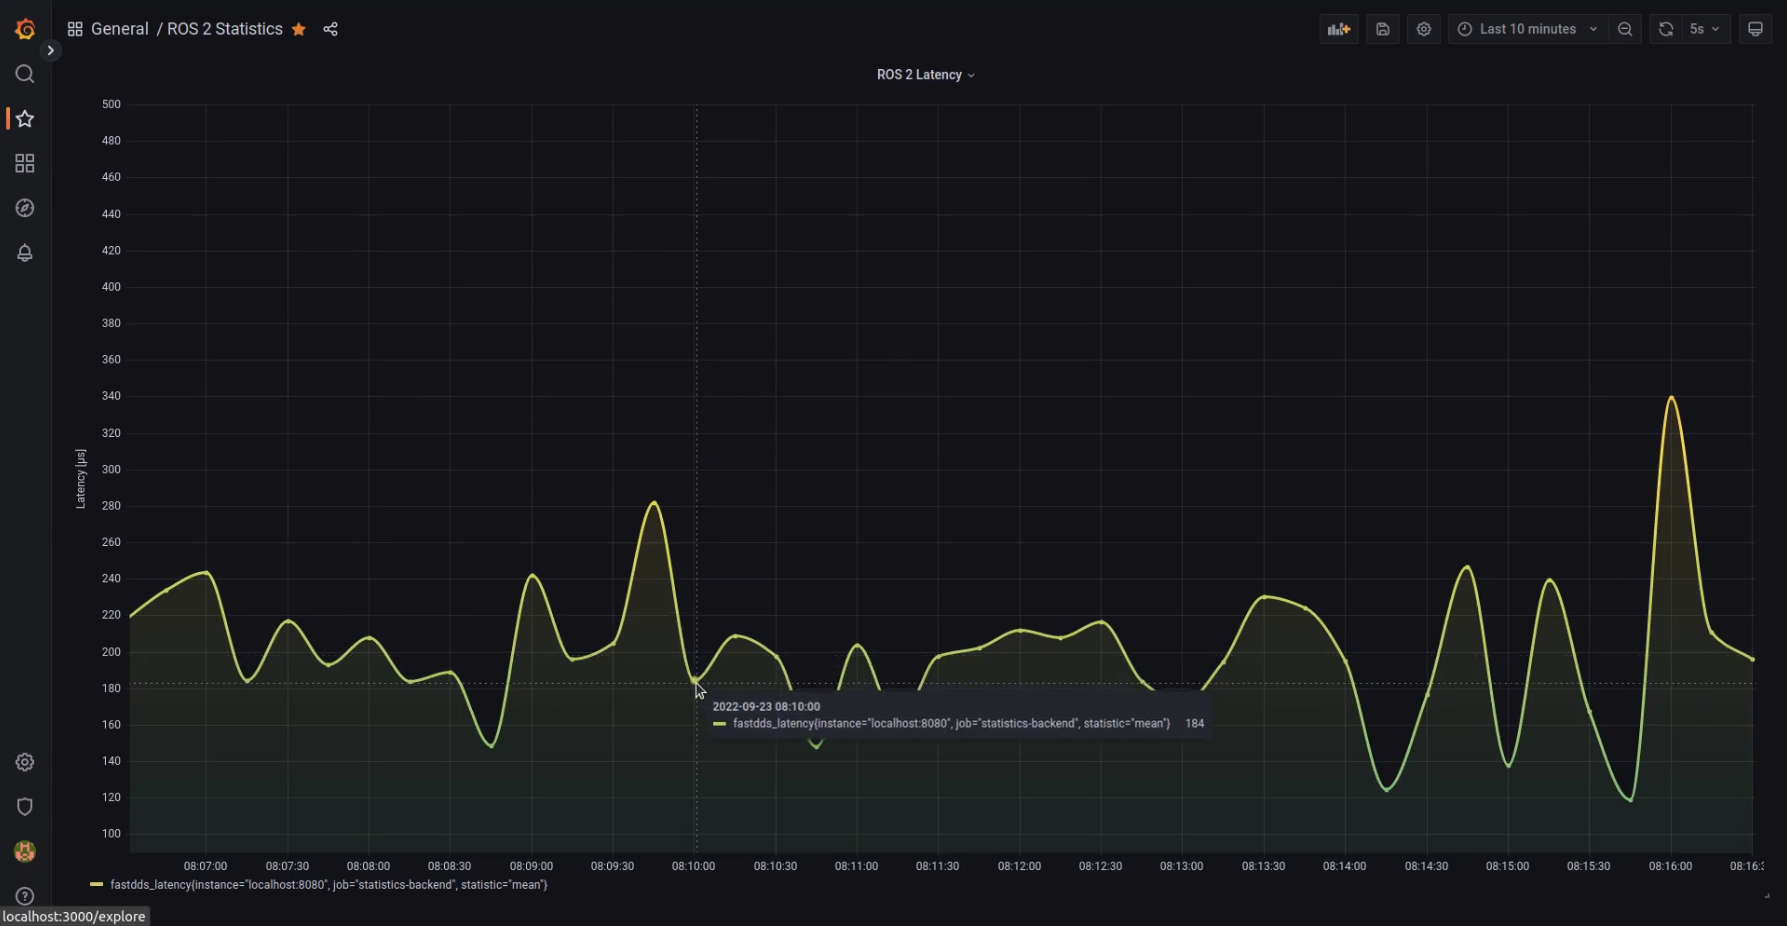
Feel free to further explore the number of possibilities that Vulcanexus Tools and Prometheus together have to offer.